Lesson Contents
If you are new to OER, I suggest stopping now and reading my Introduction to OER first. This will give you an idea of what OER is and why you might want to use it. Reading about the different OER phases will be very confusing if you don’t know the basics. After reading the introduction, it’s best to start with a basic configuration first, so you’ll see how it works. Having said that, let me show you the different phases:
- OER Profile Phase
- OER Measure Phase
- OER Apply Policy Phase
- OER Control Phase
- OER Verify Phase
These 5 phases always loop around. OER will start with the profile phase and then moves on to the measure, apply policy, control, and verify phase. After the verify phase it will go back to the profile phase, and this cycle will keep on going. Now let’s take a closer look at the different phases:
OER Profile Phase
Depending on the size of your network you might have hundreds or thousands of routes in the RIB (Routing Information Base). Optimize edge routing means that we will prefer some traffic over other traffic, so we have to select a number of routes from the RIB that we want to optimize. There are a couple of ways how we can do this:
- We can automatically learn traffic flows that experience performance issues.
- It’s also possible to manually configure different traffic classes.
So what is a “traffic class” exactly? It can be something simple like a prefix, but it’s also possible to use a prefix in combination with a port number. Border routers will learn about traffic classes and report this to the master controller. These traffic classes are then stored in a special table called the Monitored Traffic Classes (MTC) table. This MTC has a limited capacity, so by default OER will perform prefix aggregation. By default, it will aggregate (summarize) all prefixes to a /24. The MTC will store 100 prefixes, but this is something we can change if we want to.
Automatically learning of traffic classes is done by using the top talkers feature of NetFlow. You don’t have to configure NetFlow yourself. It is done for you automatically when you enable OER.
OER doesn’t check for traffic classes non-stop, but it works with a schedule:
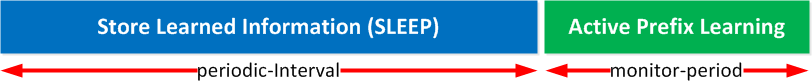
OER will learn in the monitor period, which is 5 minutes by default. Once this period is over it will go into “sleep mode” (120 minutes), and it will save the information on the prefixes that it has learned. These timers might be ok for production networks, but you might want to speed it up for your labs.
OER Measure Phase
Once we know what traffic classes we want to optimize (either by learning or configuring them ourselves), OER will measure the performance of each traffic class. There are two methods how we can do this:
- Passive monitoring
- Active monitoring
Passive monitoring uses Netflow and interface counters on the border routers. OER will measure the following performance metrics using NetFlow:
- Delay: The average delay of TCP flows for a prefix. It will keep track of TCP segments and the returning TCP ACK to calculate round-trip response time (RTT).
- Packet Loss: By keeping track of TCP sequence numbers, OER can measure packet loss.
- Reachability: OER will keep track of TCP SYNs sent without receiving a TCP ACK response.
- Throughput: The total number of bytes and packets for each traffic class in a certain time. This is one of the metrics that can be used for non-TCP traffic.
Active monitoring uses IP SLA to emulate the traffic class and discover performance metrics. Our border routers will report their information to the master controller, and the master controller will store the performance metrics together with the traffic classes in the MTC. OER can collect the following performance metrics thanks to IP SLA:
- Delay (same as above).
- Reachability (same as above).
- Jitter: A variation in delay causes jitter. OER will send multiple packets to the destination and measure the delay between them.
- MOS: The Mean Opinion Score is used to represent voice quality on a scale from 1 to 5. 1 = terrible voice quality, 5 = best voice quality
For each traffic class or interface that OER monitors, it will check the current state, and it does this by using different states:
- Default: traffic classes in the default state are not controlled by OER. When a traffic class is added to the MTC, it will be in the default state. You will see traffic classes go into and out of the default state depending on measurement results and the policy you have configured.
- Choose Exit: This is where OER compares performance metrics against the configured policy for the traffic class. OER will prefer to keep the current “exit path” for a certain traffic class, but when it exceeds its current policy, the master controller will start looking for another exit path.
- Holddown: A traffic class will be in the holddown state when the master controller tells the border router to use active probes (IP SLA) to monitor the traffic class. Performance metrics are collected until the holddown timer expires.
- In-Policy: After comparing the performance metrics against the policy and selecting an exit path, the traffic class will be in-policy. This means the traffic class doesn’t exceed our policy…the master controller will keep monitoring the traffic class but no action is taken unless the periodic timer expires or when the traffic class performance metrics exceed the policy.
- Out-of-Policy (OOP): When no exit paths conform to the policy, the traffic class will go out-of-policy. The backoff timer controls whether a traffic class can leave this state, and every time a traffic class goes to the out-of-policy state, this timer will increase. The backoff timer will reset when the traffic class goes to the in-policy state. When all exit paths are out-of-policy, the master controller can select the best exit path available.
OER Apply Policy Phase
On the master controller, we will configure a policy with certain thresholds for our traffic classes to define “acceptable performance.” OER will compare the performance metrics with the policy that we created. When the performance metrics exceed the threshold in our policy the traffic class will go OOP (Out of Policy). OER will keep comparing these results to see if there are changes in traffic flows. There are two types of policies for OER:
as expected …great post, approach,explaining and coherant style just fantastic …you just mak it so easy to understand… wonderful and thank you for blogging.
continue the good work
Thank you Sirwan