Lesson Contents
Cisco’s Medianet Performance Monitor is an extension of Flexible NetFlow (FNF). Besides the regular NetFlow information like source and/or destination IP addresses or port numbers it can collect a wide range of metrics including:
- Jitter
- Packet loss
- Transport Event Packet Loss
- Round Trip Time
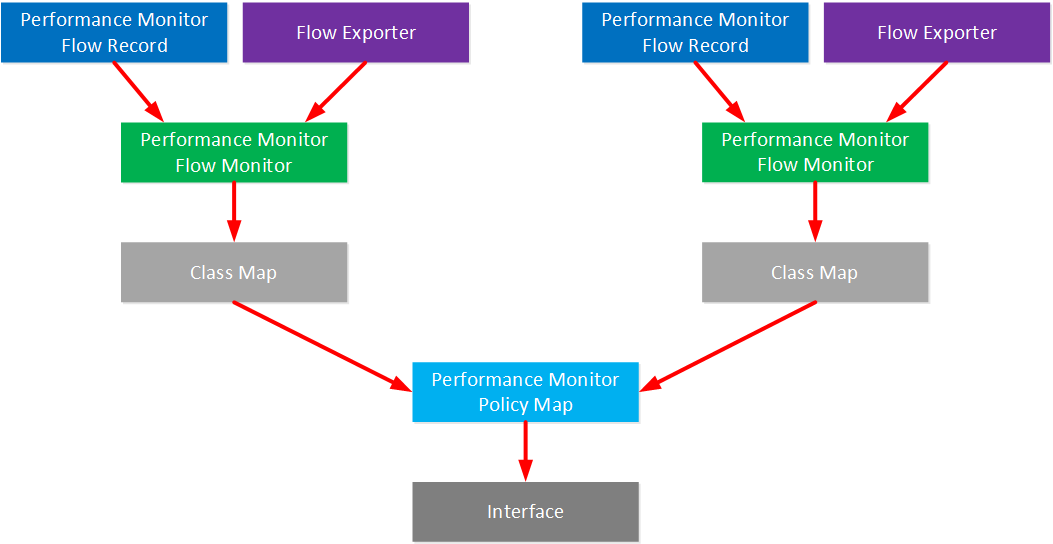
When you configure Performance Monitor, we need the following items:
- Flow record – type performance monitor: this is where we configure the metrics that we want to collect.
- Flow exporter: this is where we configure the server that we want to export our metrics to.
- Flow monitor- type performance monitor: this is where we link the flow record and flow exporter together.
- Class-map: we use a class map to define what traffic we want to monitor.
- Policy-map – type performance monitor: this is where we add all of our class maps.
- Interface: the policy-map is added to the interface. You can choose between inbound, outbound, or both directions.
Here is a visual representation of how everything is linked together:
Configuration
There are two ways to configure Performance Monitor:
- Manual: we configure all the items I explained above ourselves.
- Easy Performance Monitor (ezPM): this is a simplified configuration that only requires a few commands. It includes Cisco validates records, monitors, class-maps, policy-maps, etc.
I’ll start with the manual method so you can see all the different items one-by-one. In a production network, it’s probably best to stick to the ezPM method or you will probably spend days figuring out the correct settings.
Here is the topology we’ll use:
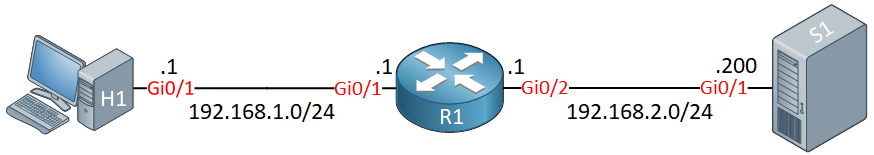
- H1 will generate some traffic with IP SLA.
- R1 will export Performance Monitor metrics to S1.
Manual
Flow Record
Let’s create two flow records:
- TCP traffic
- RTP traffic
For each traffic type, we need a flow record. I’ll add a bunch of different metrics in each flow record. Let’s start with the TCP flow record:
R1(config)#flow record type performance-monitor FLOW_RECORD_TCP
R1(config-flow-record)#match ipv4 protocol
R1(config-flow-record)#match ipv4 source address
R1(config-flow-record)#match ipv4 source prefix
R1(config-flow-record)#match ipv4 destination address
R1(config-flow-record)#match ipv4 destination prefix
R1(config-flow-record)#match transport source-port
R1(config-flow-record)#match transport destination-port
R1(config-flow-record)#collect routing forwarding-status
R1(config-flow-record)#collect ipv4 dscp
R1(config-flow-record)#collect ipv4 ttl
R1(config-flow-record)#collect ipv4 source mask
R1(config-flow-record)#collect ipv4 destination mask
R1(config-flow-record)#collect transport round-trip-time
R1(config-flow-record)#collect transport event packet-loss counter
R1(config-flow-record)#collect interface input
R1(config-flow-record)#collect interface output
R1(config-flow-record)#collect counter bytes
R1(config-flow-record)#collect counter packets
R1(config-flow-record)#collect counter bytes rate
R1(config-flow-record)#collect timestamp interval
R1(config-flow-record)#collect application media bytes counter
R1(config-flow-record)#collect application media packets rate
R1(config-flow-record)#collect application media event
R1(config-flow-record)#collect monitor event
Let’s add another one for RTP:
R1(config)#flow record type performance-monitor FLOW_RECORD_RTP
R1(config-flow-record)#match ipv4 protocol
R1(config-flow-record)#match ipv4 source address
R1(config-flow-record)#match ipv4 source prefix
R1(config-flow-record)#match ipv4 destination address
R1(config-flow-record)#match ipv4 destination prefix
R1(config-flow-record)#match transport source-port
R1(config-flow-record)#match transport destination-port
R1(config-flow-record)#match transport rtp ssrc
R1(config-flow-record)#collect routing forwarding-status
R1(config-flow-record)#collect ipv4 dscp
R1(config-flow-record)#collect ipv4 ttl
R1(config-flow-record)#collect ipv4 source mask
R1(config-flow-record)#collect ipv4 destination mask
R1(config-flow-record)#collect transport packets expected counter
R1(config-flow-record)#collect transport packets lost counter
R1(config-flow-record)#collect transport packets lost rate
R1(config-flow-record)#collect transport event packet-loss counter
R1(config-flow-record)#collect transport rtp jitter mean
R1(config-flow-record)#collect transport rtp jitter minimum
R1(config-flow-record)#collect transport rtp jitter maximum
R1(config-flow-record)#collect interface input
R1(config-flow-record)#collect interface output
R1(config-flow-record)#collect counter bytes
R1(config-flow-record)#collect counter packets
R1(config-flow-record)#collect counter bytes rate
R1(config-flow-record)#collect timestamp interval
R1(config-flow-record)#collect application media bytes counter
R1(config-flow-record)#collect application media bytes rate
R1(config-flow-record)#collect application media packets counter
R1(config-flow-record)#collect application media packets rate
R1(config-flow-record)#collect application media event
R1(config-flow-record)#collect monitor event
Above, you can see I added some metrics (for example jitter) that are useful for RTP traffic.
Flow Exporter
We want to export our metrics somewhere so we need to configure a flow exporter. I’ll export everything to a server at 192.168.2.200:
R1(config)#flow exporter NETFLOW_SERVER
R1(config-flow-exporter)#destination 192.168.2.200
R1(config-flow-exporter)#source GigabitEthernet 0/1
R1(config-flow-exporter)#transport udp 2055
R1(config-flow-exporter)#template data timeout 60
Flow Monitor
Now we can combine the flow records and flow exporter in a flow monitor. I’ll create two, one for TCP traffic and another one for RTP traffic:
R1(config)#flow monitor type performance-monitor FLOW_MONITOR_RTP
R1(config-flow-monitor)#record FLOW_RECORD_RTP
R1(config-flow-monitor)#exporter NETFLOW_SERVERR1(config)#flow monitor type performance-monitor FLOW_MONITOR_TCP
R1(config-flow-monitor)#record FLOW_RECORD_TCP
R1(config-flow-monitor)#export NETFLOW_SERVERClass-map
So far, we configure what metrics we want to collect but we still have to tell the router what traffic we want to collect. I’ll create two class-maps for this. Let’s create one that matches all TCP traffic:
R1(config)#ip access-list extended TCP_TRAFFIC
R1(config-ext-nacl)#permit tcp any any

R1(config)#class-map TCP
R1(config-cmap)#match access-group name TCP_TRAFFIC
For my RTP traffic, I’ll create a simple access-list that matches all UDP traffic. We could use NBAR to classify RTP traffic but I intend to use IP SLA to generate RTP traffic. NBAR doesn’t classify IP SLA traffic as RTP so I’ll go with a simple access-list. Let’s create it:
R1(config)#ip access-list extended UDP_TRAFFIC
R1(config-ext-nacl)#permit udp any any

R1(config)#class-map RTP
R1(config-cmap)#match access-group name UDP_TRAFFIC
Policy-map
Our class-maps are ready so we can create a new policy-map and add the class-maps to it:
R1(config)#policy-map type performance-monitor PERFORMANCE_MONITOR
R1(config-pmap)#class RTP
R1(config-pmap-c)#flow monitor FLOW_MONITOR_RTP
R1(config-pmap-c)#monitor parameters
R1(config-pmap-c-mparams)#interval duration 10
R1(config-pmap-c-mparams)#flows 100

R1(config-pmap)#class TCP
R1(config-pmap-c)#flow monitor FLOW_MONITOR_TCP
R1(config-pmap-c)#monitor parameters
R1(config-pmap-c-mparams)#flows 1000
R1(config-pmap-c-mparams)#exit
R1(config-pmap-c)#exit
Optionally, you can set parameters for each flow. Above, you can see I set a limit to the number of flows for each class-map.
Interface
Last but not least, let’s activate the policy-map on an interface. I’ll apply it in- and outbound on the interface that connects to H1:
R1(config)#interface GigabitEthernet 0/2
R1(config-if)#service-policy type performance-monitor input PERFORMANCE_MONITOR
R1(config-if)#service-policy type performance-monitor output PERFORMANCE_MONITOR
That completes our configuration.
Configurations
Want to take a look for yourself? Here you will find the startup configuration of each device.
H1
hostname H1
!
no ip routing
!
no ip cef
!
interface GigabitEthernet0/1
 ip address 192.168.1.1 255.255.255.0
!
ip default-gateway 192.168.1.254
!
ip sla 1
 udp-jitter 1.2.3.4 16384 num-packets 500 interval 4
 threshold 0
 timeout 0
 frequency 1
ip sla schedule 1 life forever start-time now
!
end
R1
hostname R1
!
ip cef
!
flow record type performance-monitor FLOW_RECORD_TCP
 match ipv4 protocol
 match ipv4 source address
 match ipv4 source prefix
 match ipv4 destination address
 match ipv4 destination prefix
 match transport source-port
 match transport destination-port
 collect routing forwarding-status
 collect ipv4 dscp
 collect ipv4 ttl
 collect ipv4 source mask
 collect ipv4 destination mask
 collect transport round-trip-time
 collect transport event packet-loss counter
 collect interface input
 collect interface output
 collect counter bytes
 collect counter packets
 collect counter bytes rate
 collect timestamp interval
 collect application media bytes counter
 collect application media packets rate
 collect application media event
 collect monitor event
!
flow record type performance-monitor FLOW_RECORD_RTP
 match ipv4 protocol
 match ipv4 source address
 match ipv4 source prefix
 match ipv4 destination address
 match ipv4 destination prefix
 match transport source-port
 match transport destination-port
 match transport rtp ssrc
 collect routing forwarding-status
 collect ipv4 dscp
 collect ipv4 ttl
 collect ipv4 source mask
 collect ipv4 destination mask
 collect transport packets expected counter
 collect transport packets lost counter
 collect transport packets lost rate
 collect transport event packet-loss counter
 collect transport rtp jitter mean
 collect transport rtp jitter minimum
 collect transport rtp jitter maximum
 collect interface input
 collect interface output
 collect counter bytes
 collect counter packets
 collect counter bytes rate
 collect timestamp interval
 collect application media bytes counter
 collect application media bytes rate
 collect application media packets counter
 collect application media packets rate
 collect application media event
 collect monitor event
!
flow exporter NETFLOW_SERVER
 destination 192.168.2.200
 source GigabitEthernet0/1
 output-features
 transport udp 2055
 template data timeout 60
 option exporter-stats
 option application-table
!
flow monitor type performance-monitor FLOW_MONITOR_RTP
 record FLOW_RECORD_RTP
 exporter NETFLOW_SERVER
 cache entries 100
!
flow monitor type performance-monitor FLOW_MONITOR_TCP
 record FLOW_RECORD_TCP
 exporter NETFLOW_SERVER
 cache entries 1000
!
class-map match-all TCP
 match access-group name TCP_TRAFFIC
class-map match-all RTP
 match access-group name UDP_TRAFFIC
!
policy-map type performance-monitor PERFORMANCE_MONITOR
 class TCP
  flow monitor FLOW_MONITOR_TCP
 class RTP
  flow monitor FLOW_MONITOR_RTP
!
interface GigabitEthernet0/1
 ip address 192.168.2.1 255.255.255.0
!
interface GigabitEthernet0/2
 ip address 192.168.1.254 255.255.255.0
 service-policy type performance-monitor input PERFORMANCE_MONITOR
 service-policy type performance-monitor output PERFORMANCE_MONITOR
!
ip access-list extended TCP_TRAFFIC
 permit tcp any any
ip access-list extended UDP_TRAFFIC
 permit udp any any
!
end
Easy Performance Monitor (ezPM)
The configuration above is pretty complex with so many pieces and parameters. ezPM is based on some best practice templates and you only need a few lines to configure it. You only need to configure a profile and traffic monitor. You can find information about those in the AVC user guide.
For the sake of completeness, let me show you the configuration commands:
R1(config)#performance monitor context EZPM profile ?
  application-experience   Application eXperience performance monitor profile
  application-performance  Application performance profile
  application-statistics   Application statistics profile
Let’s pick one of the profiles:
R1(config)#performance monitor context EZPM profile application-statisticsWe need to configure an exporter:
R1(config-perf-mon)#exporter destination 192.168.2.200 source GigabitEthernet 0/1And select a traffic monitor:
R1(config-perf-mon)#traffic-monitor ?
  application-client-server-stats  Per interface, client, server and application statistics
  application-stats                Per application and interface statistics
I’ll pick the application-stats traffic monitor:
R1(config-perf-mon)#traffic-monitor application-statsThe only thing left to do is to enable ezPM on our interface:
R1(config)#interface GigabitEthernet 0/2
R1(config-if)#performance monitor context EZPM
That’s all. A few lines to configure everything. You can then use the show performance monitor context command and it will show you what it is using behind the scenes:
R1#show performance monitor context
================================================================================
|                   Operational Information of Context EZPM                    |
================================================================================
Coarse-grain NBAR based profile

Exporters
=========
Flow Exporter EZPM-1:
  Description:              performance monitor context EZPM exporter
  Export protocol:          IPFIX (Version 10)
  Transport Configuration:
    Destination IP address: 10.56.100.253
    Source IP address:      172.16.1.56
    Source Interface:       GigabitEthernet0/1
    Transport Protocol:     UDP
    Destination Port:       4739
    Source Port:            65234
    DSCP:                   0x0
    TTL:                    255
    Output Features:        Not Used
  Options Configuration:
    interface-table (timeout 300 seconds) (active)
    vrf-table (timeout 300 seconds) (active)
    sampler-table (timeout 300 seconds) (active)
    application-table (timeout 300 seconds) (active)
    application-attributes (timeout 300 seconds) (active)
Flow Exporter EZPM-1:
  Packet send statistics (last cleared 20:44:23 ago):
    Successfully sent:         4233                  (5557680 bytes)

  Client send statistics:
    Client: Option options interface-table
      Records added:           996
        - sent:                996
      Bytes added:             99600
        - sent:                99600

    Client: Option options vrf-id-name-table
      Records added:           0
      Bytes added:             0

    Client: Option options sampler-table
      Records added:           0
      Bytes added:             0

    Client: Option options application-name
      Records added:           23406
        - sent:                23406
      Bytes added:             1942698
        - sent:                1942698

    Client: Option options application-attributes
      Records added:           16932
        - sent:                16932
      Bytes added:             3284808
        - sent:                3284808

    Client: MMA EXPORTER GROUP MMA-EXP-3
      Records added:           0
      Bytes added:             0
================================================================================
|                      Traffic Monitor: application-stats                      |
================================================================================
Class-maps
==========
 Class Map match-all EZPM-app_stats_ipv4 (id 3)
   Match protocol ip

 Class Map match-all EZPM-app_stats_ipv6 (id 4)
   Match protocol ipv6
Records and Monitors
====================
  Name           : EZPM-app_stats
  Users          : 1
  Key Fields:
    Name: flow direction
    Name: flow observation point
    Name: ip version
    Name: ip protocol
    Name: application id (172 / 0xAC)
  Non Key Fields:
    Name: routing vrf input
    Name: counter bytes long
    Name: counter packets long
    Name: timestamp sys-uptime first
    Name: timestamp sys-uptime last
    Name: connection new-connections
    Name: connection sum-duration
Flow Monitor EZPM-app_stats:
  Description:       User defined
  Flow Record:       not configured
  Cache:
    Type:                 synchronized
    Status:               not allocated
    Size:                 10000 entries / 0 bytes
    Synchronized Timeout: 60 secs
================================================================================
|                                 Policy-maps                                  |
================================================================================

  Policy Map type performance-monitor EZPM-in
    Parameter default account-on-resolution
    Class EZPM-app_stats_ipv4
      flow monitor EZPM-app_stats
          react status: inactive
    Class EZPM-app_stats_ipv6
      flow monitor EZPM-app_stats
          react status: inactive

  Policy Map type performance-monitor EZPM-out
    Parameter default account-on-resolution
    Class EZPM-app_stats_ipv4
      flow monitor EZPM-app_stats
          react status: inactive
    Class EZPM-app_stats_ipv6
      flow monitor EZPM-app_stats
          react status: inactive
================================================================================
|                            Interface Attachments                             |
================================================================================

 GigabitEthernet0/2

  Service-policy performance-monitor input: EZPM-in

    Class-map: EZPM-app_stats_ipv4 (match-all)
      0 packets, 0 bytes
      5 minute offered rate 0000 bps, drop rate 0000 bps
      Match: protocol ip
      Total Packets classified: 0
      Total Bytes classified: 0
      Monitor AOR: disabled

    Class-map: EZPM-app_stats_ipv6 (match-all)
      0 packets, 0 bytes
      5 minute offered rate 0000 bps, drop rate 0000 bps
      Match: protocol ipv6
      Total Packets classified: 0
      Total Bytes classified: 0
      Monitor AOR: disabled

    Class-map: class-default (match-any)
      0 packets, 0 bytes
      5 minute offered rate 0000 bps, drop rate 0000 bps
      Match: any

  Service-policy performance-monitor output: EZPM-out

    Class-map: EZPM-app_stats_ipv4 (match-all)
      0 packets, 0 bytes
      5 minute offered rate 0000 bps, drop rate 0000 bps
      Match: protocol ip
      Total Packets classified: 0
      Total Bytes classified: 0
      Monitor AOR: disabled

    Class-map: EZPM-app_stats_ipv6 (match-all)
      0 packets, 0 bytes
      5 minute offered rate 0000 bps, drop rate 0000 bps
      Match: protocol ipv6
      Total Packets classified: 0
      Total Bytes classified: 0
      Monitor AOR: disabled

    Class-map: class-default (match-any)
      0 packets, 0 bytes
      5 minute offered rate 0000 bps, drop rate 0000 bps
      Match: any
This is much easier to configure or you can use it as a template for your manual configuration.
Verification
Everything you see in this action is based on the “manual” configuration I started with.
Hi Rene
I am try to see the difference between Performance monitor and netflow
and what is the best solution
Hello Fabrice
Cisco Performance Monitor is not a replacement or an alternative to Netflow. CPM is an extension to Flexible Netflow, which itself is an extension to Netflow v9. Which you will choose depends on what level of monitoring you desire.
CPM is ideal for monitoring metrics for real-time applications. Metrics such as Jitter, packet loss and round trip time are all vital for such applications. CPM would be very beneficial if you have such applications, however, if you don’t, Netflow may be sufficient for your needs. You will have to evaluate this bas
... Continue reading in our forumHi Everyone,
I have just tried this lesson but don’t appear to have the full command set although my research suggests all commands should be available for these ios vers. Currently I have the following:
7200 Software (C7200-ADVENTERPRISEK9-M), Version 15.2(4)S3,
C2600-IPBASEK9-M), Version 12.4(18)
In addition to the above I have tried multiple ADVENTERPRISE images from 3000 to 7000 series in GNS3 but dont appear to have any access to the command set for these labs.. can anyone advise?
Many Thanks
Frank
Hello Frank
Take a look at the following link. It contains the various Cisco Performance Monitor commands and the IOS versions that support them for the various platforms including the 2600 and the 7200.
https://www.cisco.com/c/en/us/td/docs/ios-xml/ios/media_monitoring/command/mm-cr-book/mm-cr-perf-mon1.html
Hopefully this will give you a better idea of what’s available on your IOS versions.
I hope this has been helpful!
Laz
Hello,
In Reference to this lesson: https://networklessons.com/cisco/ccie-routing-switching-written/cisco-performance-monitor.
some of the commands do not work in my cisco 9200 series, i try using also Easy Performance Monitor (ezPM) also for the cisco 9200.not working.
Kindly assist with configuration set for netflow for 9200 switches.I am tasked to send a the netflow to a PRTG monitor.