Lesson Contents
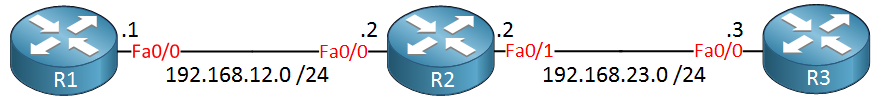
Traceroute, like the ping command can be used to isolate problems in our network. The ping command is a bit limited sometimes. For example, take a look at the following topology:
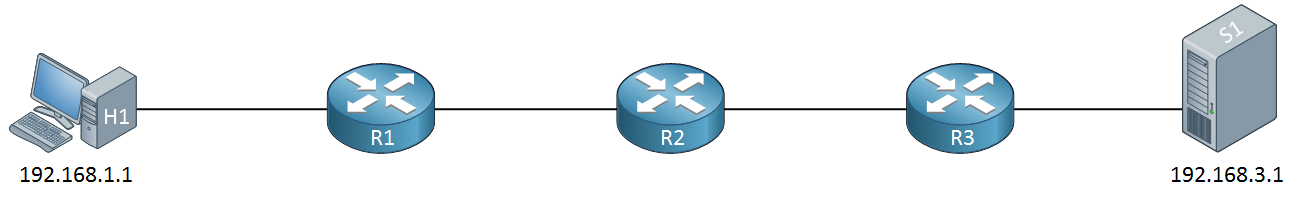
When we send a ping from H1 (192.168.1.1) to S1 (192.168.3.1) and this ping doesn’t work, what does it mean? We’ll know something is not working but we don’t know whether the problem is in between H1-R1, R1-R2, R2-R3 or R3-S1.
If you know the IP addresses of all routers in the path then you could ping all of these routers one by one. What if you have no idea how many routers are in between? Or if you don’t know their IP addresses?
The traceroute command will help us with that. Here’s a quick example:
C:\Users\renemolenaar>tracert facebook.com

Tracing route to facebook.com [31.13.64.35]
over a maximum of 30 hops:

  1     9 ms     8 ms     8 ms  D5644061.static.ziggozakelijk.nl [215.99.12.17]
  2     9 ms    14 ms     8 ms  tb-rc0001-cr101-ae40-0.core.as9143.net [213.51.158.66]
  3    10 ms    12 ms    11 ms  asd-tr0042-cr101-ae5-0.core.as9143.net [213.51.158.18]
  4    14 ms    12 ms    12 ms  br02.ams1.tfbnw.net [80.249.209.164]
  5    12 ms    12 ms    13 ms  po131.asw01.ams3.tfbnw.net [157.240.35.46]
  6    12 ms    12 ms    13 ms  po232.psw01c.amt2.tfbnw.net [157.240.35.175]
  7    13 ms    12 ms    12 ms  msw1ad.01.amt2.tfbnw.net [173.252.64.255]
  8    12 ms    11 ms    13 ms  edge-star-mini-shv-01-amt2.facebook.com [31.13.64.35]

Trace complete.
Above I used the tracert (traceroute) command on a Windows computer to trace the path from my computer to facebook.com. You can see all the IP addresses and hostnames of the routers in between my computer and the server that responds to www.facebook.com. The response times that you see is the round trip time from my computer to the router. For each router, traceroute sends three probes.
So, how does traceroute work?
Traceroute uses the TTL (Time to Live) field in the IP packet header. Normally, TTL is used to prevent packets from being forwarded forever when there is a routing loop. Whenever an IP packet is forwarded by a router, the TTL is decreased by one. When the TTL is zero, the IP packet will be discarded.
How do we use this for traceroute? Let’s look at an example. Let’s say that from H1 (192.168.1.1) we send a trace to S1 (192.168.3.1). The first IP packet that H1 sends, will have a TTL of 1:
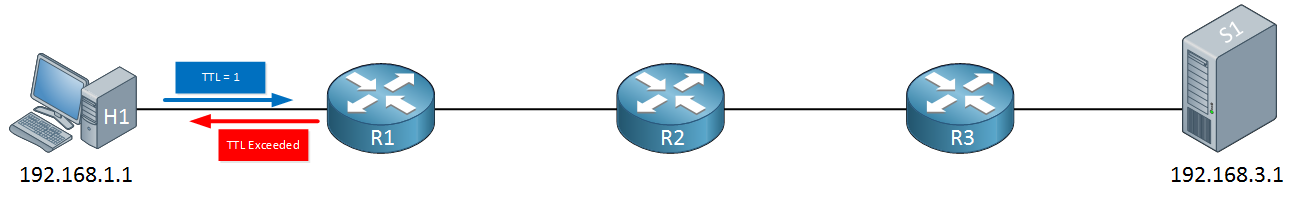
When R1 receives the IP packet, it will want to forward it to R2 but it has to decrease the TTL from one to zero, as a result, the IP packet will be dropped and R1 will respond to H1 with a TTL exceeded message. H1 will now send a second packet with a TTL of 2:
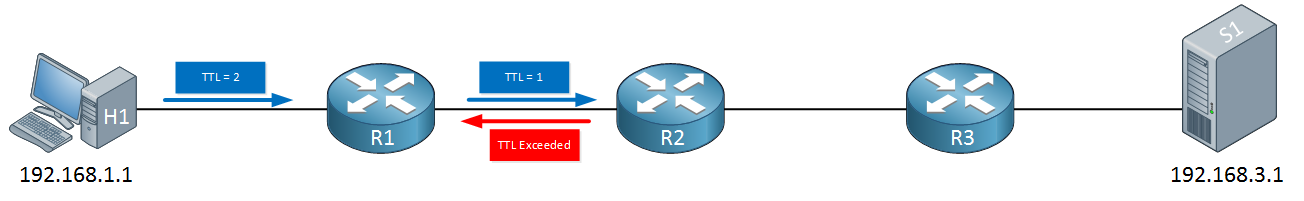
R1 will decrease the TTL from two to one, forwards it and now R2 has to drop it. R2 will respond with a TTL exceeded message. H1 will now send another IP packet with a TTL of 3:
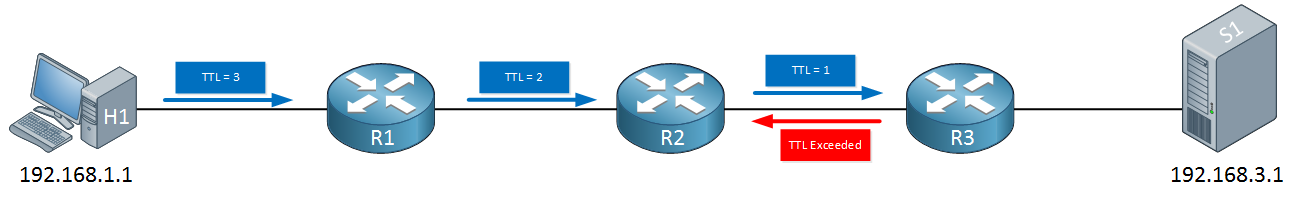
R1 will decrease the TTL from three to two, R2 decrease it from two to one and R3 will have to drop it. R3 sends the TTL exceeded message to R1. The last IP packet that H1 will send will have a TTL of four:
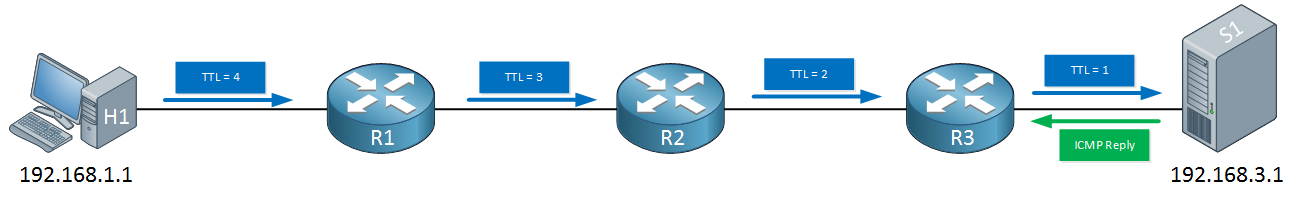
Each router will decrease the TTL by one, our server on the other end will receive an IP packet with a TTL of one and replies with an ICMP reply to H1. We now know that the destination is reachable and we have learned all routers in our path.
Each IP packet that we send is called a probe. Traceroute can be used with ICMP, UDP and TCP, depending on your operating system.
Traceroute Command
Let’s see this in action. I will use the following topology for this demonstration:
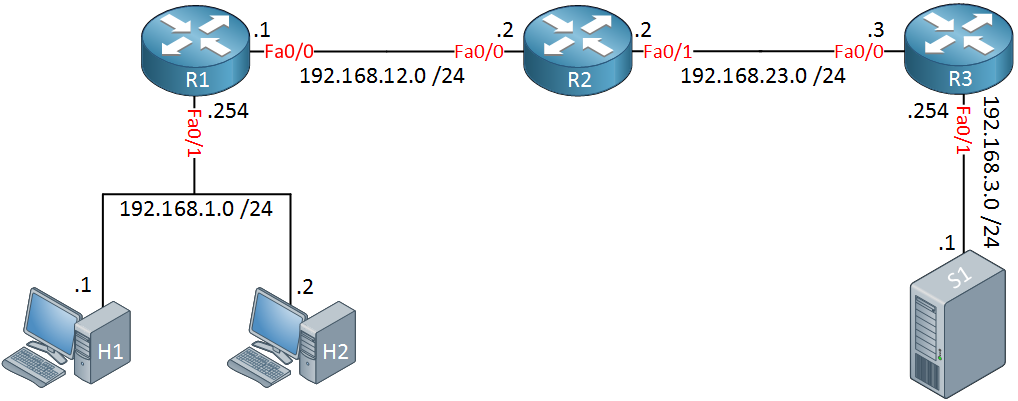
Above we have two host computers. H1 is a Windows computer (192.168.1.1) and H2 a Linux computer (192.168.1.2) running Ubuntu. The routers have been configured with EIGRP so that we have full connectivity.
Windows
Let’s start with a windows trace:
C:\Users\vmware>tracert 192.168.3.1

Tracing route to 192.168.3.1 over a maximum of 30 hops

  1     1 ms     1 ms    <1 ms  192.168.1.254
  2     1 ms     1 ms     1 ms  192.168.12.2
  3     1 ms     1 ms     1 ms  192.168.23.3
  4     1 ms    <1 ms    <1 ms  192.168.3.1

Trace complete.
Above we see all routers and the destination. For each hop, traceroute will send three IP packets. We do this to get a good average of the round trip time for each hop. Let’s see what the IP packets look like in Wireshark. Here’s the first one:
Frame 1: 106 bytes on wire (848 bits), 106 bytes captured (848 bits) on interface 0
Ethernet II, Src: Vmware_8e:02:44 (00:50:56:8e:02:44), Dst: CiscoInc_8b:36:d1 (00:1d:a1:8b:36:d1)
Internet Protocol Version 4, Src: 192.168.1.1, Dst: 192.168.3.1
    0100 .... = Version: 4
    .... 0101 = Header Length: 20 bytes
    Differentiated Services Field: 0x00 (DSCP: CS0, ECN: Not-ECT)
    Total Length: 92
    Identification: 0x03c1 (961)
    Flags: 0x00
    Fragment offset: 0
    Time to live: 1
    Protocol: ICMP (1)
    Header checksum: 0x0000 [validation disabled]
    Source: 192.168.1.1
    Destination: 192.168.3.1
    [Source GeoIP: Unknown]
    [Destination GeoIP: Unknown]
Internet Control Message Protocol
    Type: 8 (Echo (ping) request)
    Code: 0
    Checksum: 0xf786 [correct]
    Identifier (BE): 1 (0x0001)
    Identifier (LE): 256 (0x0100)
    Sequence number (BE): 120 (0x0078)
    Sequence number (LE): 30720 (0x7800)
    [No response seen]
    Data (64 bytes)
Above, we see the first IP packet with a TTL of one. We can see that this is an ICMP request. When R1 receives this IP packet, it will respond like this:
Frame 2: 70 bytes on wire (560 bits), 70 bytes captured (560 bits) on interface 0
Ethernet II, Src: CiscoInc_8b:36:d1 (00:1d:a1:8b:36:d1), Dst: Vmware_8e:02:44 (00:50:56:8e:02:44)
Internet Protocol Version 4, Src: 192.168.1.254, Dst: 192.168.1.1
    0100 .... = Version: 4
    .... 0101 = Header Length: 20 bytes
    Differentiated Services Field: 0xc0 (DSCP: CS6, ECN: Not-ECT)
    Total Length: 56
    Identification: 0x0108 (264)
    Flags: 0x00
    Fragment offset: 0
    Time to live: 255
    Protocol: ICMP (1)
    Header checksum: 0x35ad [validation disabled]
    Source: 192.168.1.254
    Destination: 192.168.1.1
    [Source GeoIP: Unknown]
    [Destination GeoIP: Unknown]
Internet Control Message Protocol
    Type: 11 (Time-to-live exceeded)
    Code: 0 (Time to live exceeded in transit)
    Checksum: 0xf4ff [correct]
Internet Protocol Version 4, Src: 192.168.1.1, Dst: 192.168.3.1
    0100 .... = Version: 4
    .... 0101 = Header Length: 20 bytes
    Differentiated Services Field: 0x00 (DSCP: CS0, ECN: Not-ECT)
    Total Length: 92
    Identification: 0x03c1 (961)
    Flags: 0x00
    Fragment offset: 0
    Time to live: 1
    Protocol: ICMP (1)
    Header checksum: 0x308e [validation disabled]
    Source: 192.168.1.1
    Destination: 192.168.3.1
    [Source GeoIP: Unknown]
    [Destination GeoIP: Unknown]
Internet Control Message Protocol
Above, we see that R1 responds with a TTL expired message to H1. In the capture file, you will see the two packets above three times. Let’s look at the next IP packet:
Frame 7: 106 bytes on wire (848 bits), 106 bytes captured (848 bits) on interface 0
Ethernet II, Src: Vmware_8e:02:44 (00:50:56:8e:02:44), Dst: CiscoInc_8b:36:d1 (00:1d:a1:8b:36:d1)
Internet Protocol Version 4, Src: 192.168.1.1, Dst: 192.168.3.1
    0100 .... = Version: 4
    .... 0101 = Header Length: 20 bytes
    Differentiated Services Field: 0x00 (DSCP: CS0, ECN: Not-ECT)
    Total Length: 92
    Identification: 0x03c7 (967)
    Flags: 0x00
    Fragment offset: 0
    Time to live: 2
    Protocol: ICMP (1)
    Header checksum: 0x0000 [validation disabled]
    Source: 192.168.1.1
    Destination: 192.168.3.1
    [Source GeoIP: Unknown]
    [Destination GeoIP: Unknown]
Internet Control Message Protocol
    Type: 8 (Echo (ping) request)
    Code: 0
    Checksum: 0xf783 [correct]
    Identifier (BE): 1 (0x0001)
    Identifier (LE): 256 (0x0100)
    Sequence number (BE): 123 (0x007b)
    Sequence number (LE): 31488 (0x7b00)
    [No response seen]
    Data (64 bytes)
This one has a TTL of two, which will make it to R2:
Frame 8: 70 bytes on wire (560 bits), 70 bytes captured (560 bits) on interface 0
Ethernet II, Src: CiscoInc_8b:36:d1 (00:1d:a1:8b:36:d1), Dst: Vmware_8e:02:44 (00:50:56:8e:02:44)
Internet Protocol Version 4, Src: 192.168.12.2, Dst: 192.168.1.1
Internet Control Message Protocol
    Type: 11 (Time-to-live exceeded)
    Code: 0 (Time to live exceeded in transit)
    Checksum: 0xf4ff [correct]
Internet Protocol Version 4, Src: 192.168.1.1, Dst: 192.168.3.1
Internet Control Message Protocol
And the third packet with a TTL of three:
Frame 13: 106 bytes on wire (848 bits), 106 bytes captured (848 bits) on interface 0
Ethernet II, Src: Vmware_8e:02:44 (00:50:56:8e:02:44), Dst: CiscoInc_8b:36:d1 (00:1d:a1:8b:36:d1)
Internet Protocol Version 4, Src: 192.168.1.1, Dst: 192.168.3.1
    0100 .... = Version: 4
    .... 0101 = Header Length: 20 bytes
    Differentiated Services Field: 0x00 (DSCP: CS0, ECN: Not-ECT)
    Total Length: 92
    Identification: 0x03ca (970)
    Flags: 0x00
    Fragment offset: 0
    Time to live: 3
    Protocol: ICMP (1)
    Header checksum: 0x0000 [validation disabled]
        [Good: False]
        [Bad: False]
    Source: 192.168.1.1
    Destination: 192.168.3.1
    [Source GeoIP: Unknown]
    [Destination GeoIP: Unknown]
Internet Control Message Protocol
    Type: 8 (Echo (ping) request)
    Code: 0
    Checksum: 0xf780 [correct]
    Identifier (BE): 1 (0x0001)
    Identifier (LE): 256 (0x0100)
    Sequence number (BE): 126 (0x007e)
    Sequence number (LE): 32256 (0x7e00)
    [No response seen]
    Data (64 bytes)
R3 will respond to it with a TTL exceeded message:
Frame 14: 70 bytes on wire (560 bits), 70 bytes captured (560 bits) on interface 0
Ethernet II, Src: CiscoInc_8b:36:d1 (00:1d:a1:8b:36:d1), Dst: Vmware_8e:02:44 (00:50:56:8e:02:44)
Internet Protocol Version 4, Src: 192.168.23.3, Dst: 192.168.1.1
    0100 .... = Version: 4
    .... 0101 = Header Length: 20 bytes
    Differentiated Services Field: 0xc0 (DSCP: CS6, ECN: Not-ECT)
    Total Length: 56
    Identification: 0x0872 (2162)
    Flags: 0x00
    Fragment offset: 0
    Time to live: 253
    Protocol: ICMP (1)
    Header checksum: 0x1b3e [validation disabled]
        [Good: False]
        [Bad: False]
    Source: 192.168.23.3
    Destination: 192.168.1.1
    [Source GeoIP: Unknown]
    [Destination GeoIP: Unknown]
Internet Control Message Protocol
    Type: 11 (Time-to-live exceeded)
    Code: 0 (Time to live exceeded in transit)
    Checksum: 0xf4ff [correct]
Internet Protocol Version 4, Src: 192.168.1.1, Dst: 192.168.3.1
Internet Control Message Protocol
Finally, the last IP packet with a TTL of four will be sent by H1:
Frame 19: 106 bytes on wire (848 bits), 106 bytes captured (848 bits) on interface 0
Ethernet II, Src: Vmware_8e:02:44 (00:50:56:8e:02:44), Dst: CiscoInc_8b:36:d1 (00:1d:a1:8b:36:d1)
Internet Protocol Version 4, Src: 192.168.1.1, Dst: 192.168.3.1
    0100 .... = Version: 4
    .... 0101 = Header Length: 20 bytes
    Differentiated Services Field: 0x00 (DSCP: CS0, ECN: Not-ECT)
    Total Length: 92
    Identification: 0x03cd (973)
    Flags: 0x00
    Fragment offset: 0
    Time to live: 4
    Protocol: ICMP (1)
    Header checksum: 0x0000 [validation disabled]
        [Good: False]
        [Bad: False]
    Source: 192.168.1.1
    Destination: 192.168.3.1
    [Source GeoIP: Unknown]
    [Destination GeoIP: Unknown]
Internet Control Message Protocol
    Type: 8 (Echo (ping) request)
    Code: 0
    Checksum: 0xf77d [correct]
    Identifier (BE): 1 (0x0001)
    Identifier (LE): 256 (0x0100)
    Sequence number (BE): 129 (0x0081)
    Sequence number (LE): 33024 (0x8100)
    [Response frame: 20]
    Data (64 bytes)
This one finally makes it to S1, so we get an ICMP reply:
Frame 20: 106 bytes on wire (848 bits), 106 bytes captured (848 bits) on interface 0
Ethernet II, Src: CiscoInc_8b:36:d1 (00:1d:a1:8b:36:d1), Dst: Vmware_8e:02:44 (00:50:56:8e:02:44)
Internet Protocol Version 4, Src: 192.168.3.1, Dst: 192.168.1.1
    0100 .... = Version: 4
    .... 0101 = Header Length: 20 bytes
    Differentiated Services Field: 0x00 (DSCP: CS0, ECN: Not-ECT)
    Total Length: 92
    Identification: 0x0899 (2201)
    Flags: 0x00
    Fragment offset: 0
    Time to live: 125
    Protocol: ICMP (1)
    Header checksum: 0xafb5 [validation disabled]
        [Good: False]
        [Bad: False]
    Source: 192.168.3.1
    Destination: 192.168.1.1
    [Source GeoIP: Unknown]
    [Destination GeoIP: Unknown]
Internet Control Message Protocol
    Type: 0 (Echo (ping) reply)
    Code: 0
    Checksum: 0xff7d [correct]
    Identifier (BE): 1 (0x0001)
    Identifier (LE): 256 (0x0100)
    Sequence number (BE): 129 (0x0081)
    Sequence number (LE): 33024 (0x8100)
    [Request frame: 19]
    [Response time: 1.248 ms]
    Data (64 bytes)
That’s how traceroute works on Windows. You can take a look at the capture file yourself if you want:
Packet Capture: Traceroute Windows
Linux
The traceroute commands on Linux works similar to Windows. One important difference is that it doesn’t use ICMP but UDP. It also allows you to specify the number of IP packets (probes) you want to send. To create a nice clean wireshark capture, I configured it to send only one probe for each hop:
$ traceroute -N 1 -q 1 192.168.3.1
traceroute to 192.168.3.1 (192.168.3.1), 30 hops max, 60 byte packets
 1  192.168.1.254 (192.168.1.254)  1.202 ms
 2  192.168.12.2 (192.168.12.2)  1.122 ms
 3  192.168.23.3 (192.168.23.3)  1.192 ms
 4  192.168.3.1 (192.168.3.1)  1.886 ms
Here’s what this traceroute looks like in Wireshark:
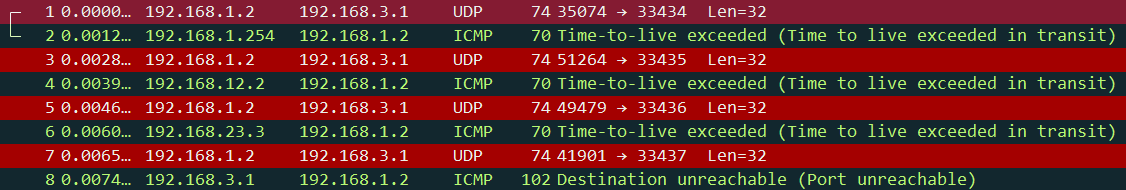
Above we can see that H2 is sending UDP packets instead of ICMP requests. Let’s take a closer look at these packets. Here’s the first one:
Frame 1: 74 bytes on wire (592 bits), 74 bytes captured (592 bits) on interface 0
Ethernet II, Src: Vmware_8e:37:ea (00:50:56:8e:37:ea), Dst: CiscoInc_8b:36:d1 (00:1d:a1:8b:36:d1)
Internet Protocol Version 4, Src: 192.168.1.2, Dst: 192.168.3.1
    0100 .... = Version: 4
    .... 0101 = Header Length: 20 bytes
    Differentiated Services Field: 0x00 (DSCP: CS0, ECN: Not-ECT)
    Total Length: 60
    Identification: 0x5666 (22118)
    Flags: 0x00
    Fragment offset: 0
    Time to live: 1
    Protocol: UDP (17)
    Header checksum: 0xddf7 [validation disabled]
    Source: 192.168.1.2
    Destination: 192.168.3.1
    [Source GeoIP: Unknown]
    [Destination GeoIP: Unknown]
User Datagram Protocol, Src Port: 35074 (35074), Dst Port: 33434 (33434)
Data (32 bytes)
Above we see that H2 is sending the first IP packet with a TTL of one. We see we use UDP and the destination port number is 33434. R1 will reply to this:
Frame 2: 70 bytes on wire (560 bits), 70 bytes captured (560 bits) on interface 0
Ethernet II, Src: CiscoInc_8b:36:d1 (00:1d:a1:8b:36:d1), Dst: Vmware_8e:37:ea (00:50:56:8e:37:ea)
Internet Protocol Version 4, Src: 192.168.1.254, Dst: 192.168.1.2
    0100 .... = Version: 4
    .... 0101 = Header Length: 20 bytes
    Differentiated Services Field: 0xc0 (DSCP: CS6, ECN: Not-ECT)
    Total Length: 56
    Identification: 0x0bea (3050)
    Flags: 0x00
    Fragment offset: 0
    Time to live: 255
    Protocol: ICMP (1)
    Header checksum: 0x2aca [validation disabled]
    Source: 192.168.1.254
    Destination: 192.168.1.2
    [Source GeoIP: Unknown]
    [Destination GeoIP: Unknown]
Internet Control Message Protocol
    Type: 11 (Time-to-live exceeded)
    Code: 0 (Time to live exceeded in transit)
    Checksum: 0x6f92 [correct]
Internet Protocol Version 4, Src: 192.168.1.2, Dst: 192.168.3.1
User Datagram Protocol, Src Port: 35074 (35074), Dst Port: 33434 (33434)
Since the TTL is zero, R1 drops it and replies with a TTL exceeded message. Time for the second IP packet with a TTL of two:
Frame 3: 74 bytes on wire (592 bits), 74 bytes captured (592 bits) on interface 0
Ethernet II, Src: Vmware_8e:37:ea (00:50:56:8e:37:ea), Dst: CiscoInc_8b:36:d1 (00:1d:a1:8b:36:d1)
Internet Protocol Version 4, Src: 192.168.1.2, Dst: 192.168.3.1
    0100 .... = Version: 4
    .... 0101 = Header Length: 20 bytes
    Differentiated Services Field: 0x00 (DSCP: CS0, ECN: Not-ECT)
    Total Length: 60
    Identification: 0x5667 (22119)
    Flags: 0x00
    Fragment offset: 0
    Time to live: 2
    Protocol: UDP (17)
    Header checksum: 0xdcf6 [validation disabled]
    Source: 192.168.1.2
    Destination: 192.168.3.1
    [Source GeoIP: Unknown]
    [Destination GeoIP: Unknown]
User Datagram Protocol, Src Port: 51264 (51264), Dst Port: 33435 (33435)
Data (32 bytes)
The packet above is the same as the first one, except you can see that the destination port number has increased from 33434 to 33435. R2 will drop this:
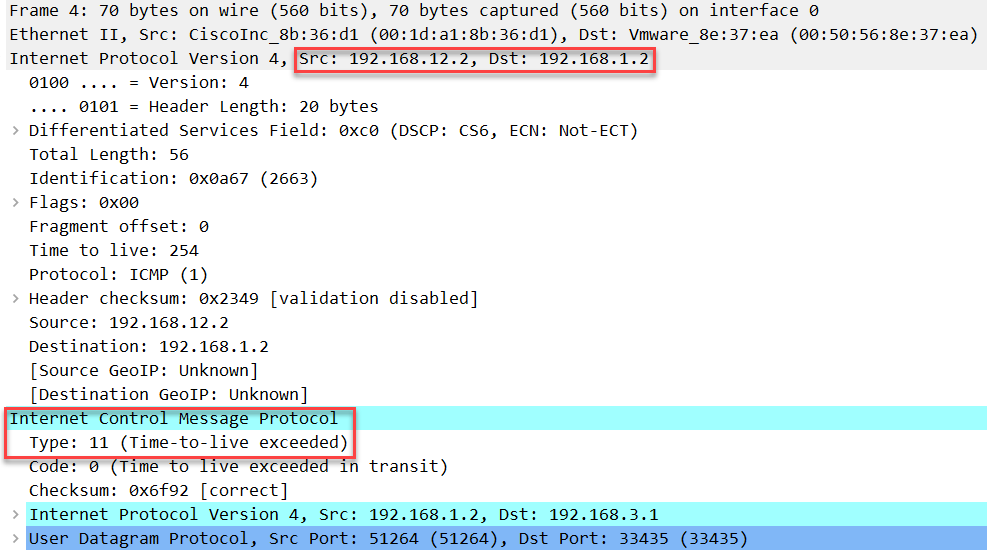
Frame 4: 70 bytes on wire (560 bits), 70 bytes captured (560 bits) on interface 0
Ethernet II, Src: CiscoInc_8b:36:d1 (00:1d:a1:8b:36:d1), Dst: Vmware_8e:37:ea (00:50:56:8e:37:ea)
Internet Protocol Version 4, Src: 192.168.12.2, Dst: 192.168.1.2
    0100 .... = Version: 4
    .... 0101 = Header Length: 20 bytes
    Differentiated Services Field: 0xc0 (DSCP: CS6, ECN: Not-ECT)
    Total Length: 56
    Identification: 0x0a67 (2663)
    Flags: 0x00
    Fragment offset: 0
    Time to live: 254
    Protocol: ICMP (1)
    Header checksum: 0x2349 [validation disabled]
    Source: 192.168.12.2
    Destination: 192.168.1.2
    [Source GeoIP: Unknown]
    [Destination GeoIP: Unknown]
Internet Control Message Protocol
    Type: 11 (Time-to-live exceeded)
    Code: 0 (Time to live exceeded in transit)
    Checksum: 0x6f92 [correct]
Internet Protocol Version 4, Src: 192.168.1.2, Dst: 192.168.3.1
User Datagram Protocol, Src Port: 51264 (51264), Dst Port: 33435 (33435)
Time for packet with a TTL of three:
Frame 5: 74 bytes on wire (592 bits), 74 bytes captured (592 bits) on interface 0
Ethernet II, Src: Vmware_8e:37:ea (00:50:56:8e:37:ea), Dst: CiscoInc_8b:36:d1 (00:1d:a1:8b:36:d1)
Internet Protocol Version 4, Src: 192.168.1.2, Dst: 192.168.3.1
    0100 .... = Version: 4
    .... 0101 = Header Length: 20 bytes
    Differentiated Services Field: 0x00 (DSCP: CS0, ECN: Not-ECT)
    Total Length: 60
    Identification: 0x5668 (22120)
    Flags: 0x00
    Fragment offset: 0
    Time to live: 3
    Protocol: UDP (17)
    Header checksum: 0xdbf5 [validation disabled]
    Source: 192.168.1.2
    Destination: 192.168.3.1
    [Source GeoIP: Unknown]
    [Destination GeoIP: Unknown]
User Datagram Protocol, Src Port: 49479 (49479), Dst Port: 33436 (33436)
Data (32 bytes)
Above, you can see the destination port number has increased from 33435 to 33436. R3 will drop this:
Frame 6: 70 bytes on wire (560 bits), 70 bytes captured (560 bits) on interface 0
Ethernet II, Src: CiscoInc_8b:36:d1 (00:1d:a1:8b:36:d1), Dst: Vmware_8e:37:ea (00:50:56:8e:37:ea)
Internet Protocol Version 4, Src: 192.168.23.3, Dst: 192.168.1.2
    0100 .... = Version: 4
    .... 0101 = Header Length: 20 bytes
    Differentiated Services Field: 0xc0 (DSCP: CS6, ECN: Not-ECT)
    Total Length: 56
    Identification: 0x1282 (4738)
    Flags: 0x00
    Fragment offset: 0
    Time to live: 253
    Protocol: ICMP (1)
    Header checksum: 0x112d [validation disabled]
    Source: 192.168.23.3
    Destination: 192.168.1.2
    [Source GeoIP: Unknown]
    [Destination GeoIP: Unknown]
Internet Control Message Protocol
    Type: 11 (Time-to-live exceeded)
    Code: 0 (Time to live exceeded in transit)
    Checksum: 0x6f92 [correct]
Internet Protocol Version 4, Src: 192.168.1.2, Dst: 192.168.3.1
User Datagram Protocol, Src Port: 49479 (49479), Dst Port: 33436 (33436)
The last packet will have a TTL of four and a destination port number of 33437:
Frame 7: 74 bytes on wire (592 bits), 74 bytes captured (592 bits) on interface 0
Ethernet II, Src: Vmware_8e:37:ea (00:50:56:8e:37:ea), Dst: CiscoInc_8b:36:d1 (00:1d:a1:8b:36:d1)
Internet Protocol Version 4, Src: 192.168.1.2, Dst: 192.168.3.1
    0100 .... = Version: 4
    .... 0101 = Header Length: 20 bytes
    Differentiated Services Field: 0x00 (DSCP: CS0, ECN: Not-ECT)
    Total Length: 60
    Identification: 0x5669 (22121)
    Flags: 0x00
    Fragment offset: 0
    Time to live: 4
    Protocol: UDP (17)
    Header checksum: 0xdaf4 [validation disabled]
    Source: 192.168.1.2
    Destination: 192.168.3.1
    [Source GeoIP: Unknown]
    [Destination GeoIP: Unknown]
User Datagram Protocol, Src Port: 41901 (41901), Dst Port: 33437 (33437)
Data (32 bytes)
This one will make it all the way to S1. Since S1 is not listening on any of these UDP port numbers, it will reply that the destination/port is unreachable:
Frame 8: 102 bytes on wire (816 bits), 102 bytes captured (816 bits) on interface 0
Ethernet II, Src: CiscoInc_8b:36:d1 (00:1d:a1:8b:36:d1), Dst: Vmware_8e:37:ea (00:50:56:8e:37:ea)
Internet Protocol Version 4, Src: 192.168.3.1, Dst: 192.168.1.2
    0100 .... = Version: 4
    .... 0101 = Header Length: 20 bytes
    Differentiated Services Field: 0x00 (DSCP: CS0, ECN: Not-ECT)
    Total Length: 88
    Identification: 0x09a2 (2466)
    Flags: 0x00
    Fragment offset: 0
    Time to live: 125
    Protocol: ICMP (1)
    Header checksum: 0xaeaf [validation disabled]
    Source: 192.168.3.1
    Destination: 192.168.1.2
    [Source GeoIP: Unknown]
    [Destination GeoIP: Unknown]
Internet Control Message Protocol
    Type: 3 (Destination unreachable)
    Code: 3 (Port unreachable)
    Checksum: 0x828a [correct]
    Unused: 00000000
Internet Protocol Version 4, Src: 192.168.1.2, Dst: 192.168.3.1
User Datagram Protocol, Src Port: 41901 (41901), Dst Port: 33437 (33437)
Data (32 bytes)
This tells H2 that we made it to the destination.
Packet Capture: Traceroute Linux
Cisco IOS
We can also use the traceroute command on Cisco IOS. Like Linux, Cisco uses UDP for traceroute. Let’s do a trace from R1 to S1, I will use a single probe:
R1#traceroute 192.168.3.1 probe 1
Type escape sequence to abort.
Tracing the route to 192.168.3.1
VRF info: (vrf in name/id, vrf out name/id)
  1 192.168.12.2 0 msec
  2 192.168.23.3 4 msec
  3 192.168.3.1 0 msec
Above we see that this trace makes it to the destination.
Here’s what the capture looks like in Wireshark:
This capture is the same as the Linux capture we just looked at so I won’t add the screenshots again. You will find the capture file at the end of this lesson if you want to see it for yourself.
Let’s look at some of the options of the traceroute command instead:
R1#traceroute ?
  WORD       Trace route to destination address or hostname
  appletalk  AppleTalk Trace
  clns       ISO CLNS Trace
  ethernet   Ethernet Traceroute
  ip         IP Trace
  ipv6       IPv6 Trace
  ipx        IPX Trace
  mpls       MPLS LSP Trace
  <cr>
We can choose if we want to trace an IP address or a hostname. If you don’t specify anything, then you can choose some parameters that you want to use:
R1#traceroute
Protocol [ip]:
Target IP address: 192.168.3.1
Source address:
Numeric display [n]: y
Timeout in seconds [3]:
Probe count [3]:
Minimum Time to Live [1]:
Maximum Time to Live [30]:
Port Number [33434]:
Loose, Strict, Record, Timestamp, Verbose[none]:
Type escape sequence to abort.
Tracing the route to 192.168.3.1
VRF info: (vrf in name/id, vrf out name/id)
  1 192.168.12.2 0 msec 4 msec 0 msec
  2 192.168.23.3 4 msec 0 msec 4 msec
  3 192.168.3.1 0 msec 0 msec 0 msec
You can also add these parameters behind the IP address, like this:
R1#traceroute 192.168.3.1 ?
  numeric  display numeric address
  port     specify port number
  probe    specify number of probes per hop
  source   specify source address or name
  timeout  specify time out
  ttl      specify minimum and maximum ttl
  <cr>
Like I did when I specified the number of probes:
R1#traceroute 192.168.3.1 probe 1Here you can find the capture file if you want to see it for yourself:
Packet Capture: Traceroute Cisco IOS
Troubleshooting
You have now seen the output of the traceroute command when everything worked as it should. Let’s look at two examples where we don’t have end-to-end connectivity. I only need these three routers for this example:
Destination Unreachable
Let’s start with a destination that is unreachable. I will add a new loopback on R3 with an IP address:
R3(config)#interface loopback 0
R3(config-if)#ip address 3.3.3.3 255.255.255.255
Right now, none of our routers know how to reach 3.3.3.3. Let’s see what the traceroute output looks like:
R1#traceroute 3.3.3.3
Type escape sequence to abort.
Tracing the route to 3.3.3.3
VRF info: (vrf in name/id, vrf out name/id)
  1  *  *  *
  2  *  *  *
  3  *  *  *
Above we see that none of the probes make it to the destination. Let’s add a static route on R1 so that this traffic makes it to R2 at least:
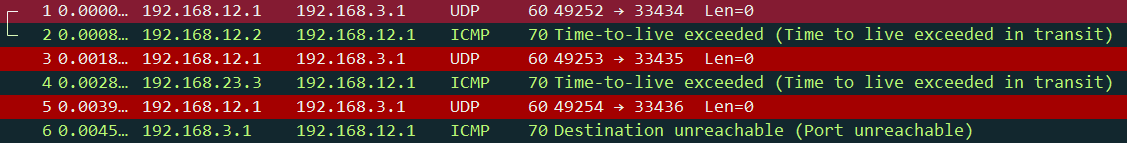
R1(config)#ip route 3.3.3.3 255.255.255.255 192.168.12.2And do another traceroute:
R1#traceroute 3.3.3.3
Type escape sequence to abort.
Tracing the route to 3.3.3.3
VRF info: (vrf in name/id, vrf out name/id)
  1 192.168.12.2 4 msec 0 msec 4 msec
  2 192.168.12.2 !H  *  !H
Now we can see that R1 is able to forward it, R2 responds that it’s unreachable. Let’s add the static route on R2:
R2(config)#ip route 3.3.3.3 255.255.255.255 192.168.23.3And try one more trace:
R1#traceroute 3.3.3.3
Type escape sequence to abort.
Tracing the route to 3.3.3.3
VRF info: (vrf in name/id, vrf out name/id)
  1 192.168.12.2 0 msec 4 msec 0 msec
  2 192.168.23.3 4 msec *  0 msec
Now we are able to make it to the destination.
Source Unreachable
We can use traceroute to figure out if we can reach a certain destination, but you can also use it to check if other routers know about your source. Let’s add another loopback interface, this time on R1:
R1(config)#interface loopback 0
R1(config-if)#ip address 1.1.1.1 255.255.255.255
I will now do a traceroute to 192.168.3.1 with 1.1.1.1 as our source. We know that 192.168.3.1 is reachable since we tried it before. Let’s take a look:
R1#traceroute 192.168.3.1 source loopback 0
Type escape sequence to abort.
Tracing the route to 192.168.3.1
VRF info: (vrf in name/id, vrf out name/id)
  1  *  *  *
  2  *  *  *
  3  *  *  *
This trace is failing. Nobody knows how to reach 1.1.1.1. Let’s add a static route on R2:
R2(config)#ip route 1.1.1.1 255.255.255.255 192.168.12.1R2 now knows how to reach 1.1.1.1. Let’s try that traceroute again:
R1#traceroute 192.168.3.1 source loopback 0
Type escape sequence to abort.
Tracing the route to 192.168.3.1
VRF info: (vrf in name/id, vrf out name/id)
  1 192.168.12.2 0 msec 4 msec 0 msec
  2  *  *  *
  3  *  *  *
R2 is now responding. This tells us that the problem is not between R1 and R2 but somewhere further down the line. Let’s add the last static route:
Hi Rene,
Good stuff as always.
I have a questions regarding Probe keyword. How router calculating 3 rtt. Could you Pls make it clear once again.Thx
Br/Zaman
Hello Mohammad
The probe keyword in Cisco IOS just tells the router how many packets to send. A probe is essentially one ICMP packet. The router responds with three lines as shown below:
There are three lines because traceroute provides a response from each router that is traversed.
I hope this has been helpful!
Laz
Hi Laz ,
Still I am confused regarding Probe 1 Keyword that from the capture we saw sender sending 3 ICMP request packet (for Windows) while we used probe 1 keyword .So what is the meaning your sentence “The probe keyword in Cisco IOS just tells the router how many packets to send” . Actually I want to know how the 3 rtt value coming …
The number of probes is the number of packets that is sent per hop. If you see 3x RTT, it means 3 probes were sent to each router. These wireshark captures might help:
Linux traceroute 1 probe
Windows traceroute 3 probes
In the linux capture, only 1 probe is sent to each router. The windows capture has 3 probes for each router.
Thanks Rene and that’s why We like you badly