Lesson Contents
Network management protocols like SNMP allow us to monitor our network. We can check things like cpu load, memory usage, interface status and even the load of an interface. Other tools like NBAR allow us to see what kind of protocols are used.
One of the things we can’t do with those tools is tracking all flows in our network. A flow is a stream of packets that share the same characteristics like source/destination port, source/destination address, protocol, type, service marking, etc.
NetFlow allows us to track these flows on our network. We can use this information to solve problems like bottlenecks, identify what applications are used, how much bandwidth they use etc.
For each of the flows, NetFlow will track the number of packets sent, bytes sent, packet sizes and more. You can configure your router to keep track of all flows and then export them to a central server where we analyze our traffic.
In this lesson I will show you how to configure NetFlow on a Cisco IOS router and we will take a look at a NetFlow server.
Configuration
This is the topology we will use:

On the left side we have a host that will be browsing the Internet through R1. At the bottom there’s a ntop server. This is open source traffic analysis software that supports NetFlow so if you want to give this a try, it’s worth checking out.
Configuring ntop is outside the scope of this lesson so I’ll focus on how to configure the router. First we have to specify the server:
R1(config)#ip flow-export destination 192.168.1.1 2055The router will export all flows to 192.168.1.1 with destination UDP port 2055. NetFlow supports multiple versions so if you want to use a specific version, here’s how to do it:
R1(config)#ip flow-export version 9I will configure the router to use version 9. Optionally, we can configure what interface the router should use to source the updates from:
R1(config)#ip flow-export source FastEthernet 0/0The last thing we have to do is tell the router on what interfaces to track the flows:
R1(config)#interface FastEthernet 0/1
R1(config-if)#ip route-cache flow
I will use the ip route-cache flow command for this. When you use this command, it will track all ingress flows on the physical and all sub-interfaces. You can also use the ip flow egress or ip flow ingress commands if you only want to enable it on one sub-interface or in one direction.
Everything is now in place, let’s verify our work.
Verification
Cisco IOS Router
On our router we can check a couple of things to see if NetFlow is working. Here’s the first command:
R1#show ip flow export
Flow export v9 is enabled for main cache
  Export source and destination details :
  VRF ID : Default
    Source(1)       192.168.1.254 (FastEthernet0/0)
    Destination(1)  192.168.1.1 (2055)
  Version 9 flow records
  433 flows exported in 28 udp datagrams
  0 flows failed due to lack of export packet
  0 export packets were sent up to process level
  0 export packets were dropped due to no fib
  0 export packets were dropped due to adjacency issues
  0 export packets were dropped due to fragmentation failures
  0 export packets were dropped due to encapsulation fixup failures
Above you can see the version of NetFlow, the source, destination and how many flows have been exported. With the next command you can see some information about the flows:
R1#show ip cache flow
IP packet size distribution (98406 total packets):
   1-32   64   96  128  160  192  224  256  288  320  352  384  416  448  480
   .000 .013 .000 .001 .000 .000 .000 .000 .000 .000 .000 .000 .000 .000 .000

    512  544  576 1024 1536 2048 2560 3072 3584 4096 4608
   .000 .000 .000 .010 .966 .000 .000 .000 .000 .000 .000

IP Flow Switching Cache, 278544 bytes
  37 active, 4059 inactive, 680 added
  10154 ager polls, 0 flow alloc failures
  Active flows timeout in 30 minutes
  Inactive flows timeout in 15 seconds
IP Sub Flow Cache, 34056 bytes
  37 active, 987 inactive, 680 added, 680 added to flow
  0 alloc failures, 0 force free
  1 chunk, 1 chunk added
  last clearing of statistics never
Protocol         Total    Flows   Packets Bytes  Packets Active(Sec) Idle(Sec)
--------         Flows     /Sec     /Flow  /Pkt     /Sec     /Flow     /Flow
TCP-WWW            262      0.1       360  1479     41.1       3.2       8.6
TCP-other          153      0.0        21  1014      1.4       2.5       9.2
UDP-other          228      0.0         1   153      0.0       0.0      15.4
Total:             643      0.2       152  1461     42.7       1.9      11.2

SrcIf         SrcIPaddress    DstIf         DstIPaddress    Pr SrcP DstP  Pkts
Fa0/1         52.17.234.27    Fa0/0         10.56.102.41    06 0050 C1AA     1

SrcIf         SrcIPaddress    DstIf         DstIPaddress    Pr SrcP DstP  Pkts
Fa0/1         23.52.59.27     Fa0/0         10.56.102.41    06 0050 C21D     5
Fa0/1         8.8.8.8         Local         10.56.102.41    11 0035 F244     1
Fa0/1         185.54.150.17   Fa0/0         10.56.102.41    06 0050 C228     3
Fa0/1         8.8.8.8         Local         10.56.102.41    11 0035 D424     1
Fa0/1         8.8.8.8         Local         10.56.102.41    11 0035 D4C1     1
Fa0/1         8.8.8.8         Local         10.56.102.41    11 0035 D4D4     1
Fa0/1         8.8.8.8         Local         10.56.102.41    11 0035 C4F5     1
Fa0/1         8.8.8.8         Local         10.56.102.41    11 0035 E92E     1
Fa0/1         8.8.8.8         Local         10.56.102.41    11 0035 C93C     1
Fa0/1         8.8.8.8         Local         10.56.102.41    11 0035 CD0E     1
Fa0/1         31.22.80.141    Fa0/0         10.56.102.41    06 0050 C21F    46
Fa0/1         31.22.80.141    Fa0/0         10.56.102.41    06 0050 C225    40
Fa0/1         31.22.80.141    Fa0/0         10.56.102.41    06 0050 C224    36
Fa0/1         31.22.80.141    Fa0/0         10.56.102.41    06 0050 C223    42
Fa0/1         31.22.80.141    Fa0/0         10.56.102.41    06 0050 C222    48
Fa0/1         31.22.80.141    Fa0/0         10.56.102.41    06 0050 C220    57
Fa0/1         8.8.8.8         Local         10.56.102.41    11 0035 DDDA     1
Fa0/1         74.125.71.138   Fa0/0         10.56.102.41    06 01BB C1FF     2
Fa0/1         74.125.71.138   Fa0/0         10.56.102.41    06 01BB C21E     8
Fa0/1         213.239.154.20  Fa0/0         10.56.102.41    06 01BB C21C     8
Fa0/1         213.239.154.21  Fa0/0         10.56.102.41    06 0050 C227     2
Fa0/1         213.239.154.21  Fa0/0         10.56.102.41    06 0050 C226     3
Fa0/1         213.239.154.21  Fa0/0         10.56.102.41    06 0050 C227     1
Fa0/1         213.239.154.21  Fa0/0         10.56.102.41    06 0050 C226     1

SrcIf         SrcIPaddress    DstIf         DstIPaddress    Pr SrcP DstP  Pkts
Fa0/1         213.239.154.21  Fa0/0         10.56.102.41    06 0050 C221     3
Fa0/1         213.239.154.21  Fa0/0         10.56.102.41    06 0050 C221     4
Fa0/1         213.239.154.20  Fa0/0         10.56.102.41    06 0050 C217    12
Fa0/1         213.239.154.20  Fa0/0         10.56.102.41    06 0050 C217     3
Fa0/1         213.239.154.21  Fa0/0         10.56.102.41    06 0050 C219    42
Fa0/1         213.239.154.20  Fa0/0         10.56.102.41    06 0050 C21B     3
Fa0/1         213.239.154.21  Fa0/0         10.56.102.41    06 0050 C21A    10
Fa0/1         213.239.154.21  Fa0/0         10.56.102.41    06 0050 C218    58
Fa0/1         213.239.154.21  Fa0/0         10.56.102.41    06 0050 C219    11
Fa0/1         213.239.154.20  Fa0/0         10.56.102.41    06 0050 C21B     3
Fa0/1         213.239.154.21  Fa0/0         10.56.102.41    06 0050 C21A    92
Fa0/1         213.239.154.21  Fa0/0         10.56.102.41    06 0050 C218     9
Fa0/1         74.125.71.154   Fa0/0         10.56.102.41    06 0050 C229     4
Above you can see some of the flows. The output above is useful to check if NetFlow is working on the router but it’s far more interesting to look at the flows on the external server.
Ntop Server
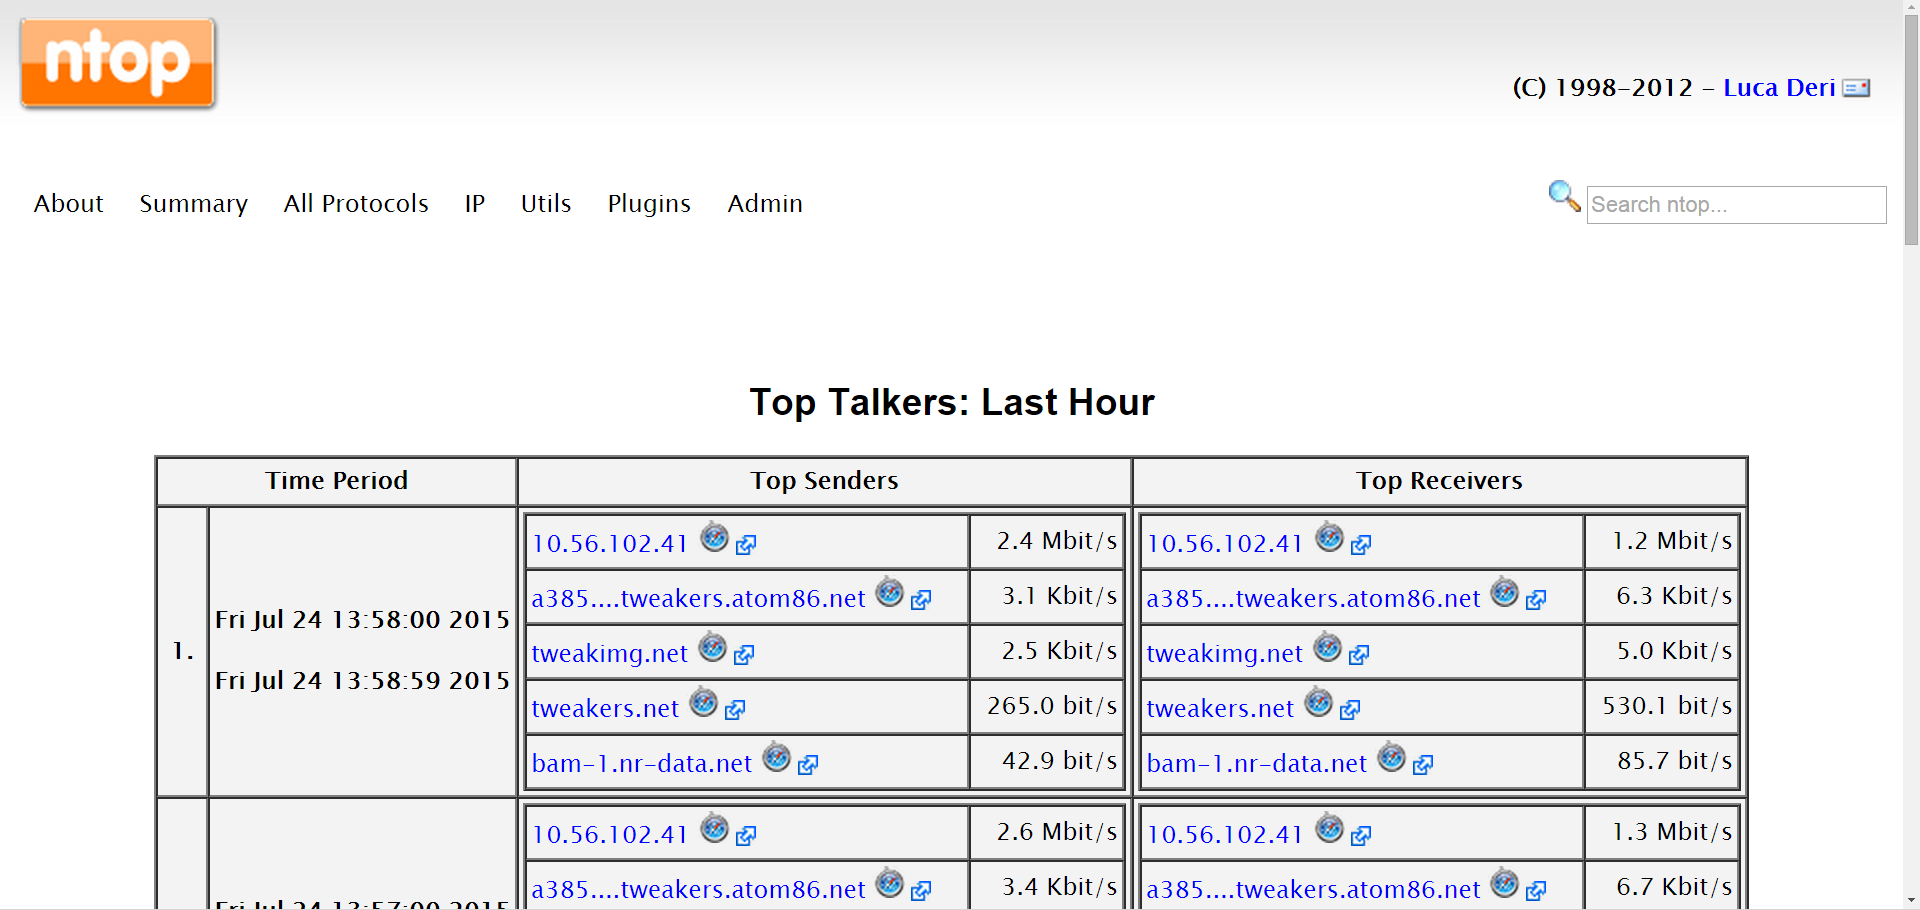
To show you what makes Netflow so useful, let me show you some screenshots of Ntop. Here you can see the top talkers of all flows:
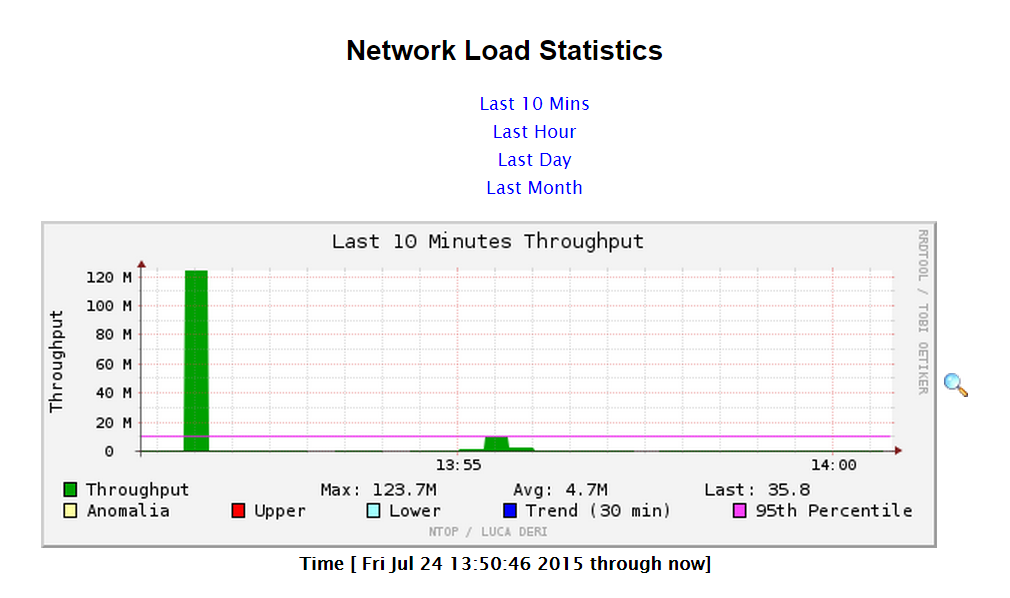
Ntop can also show you the network load:
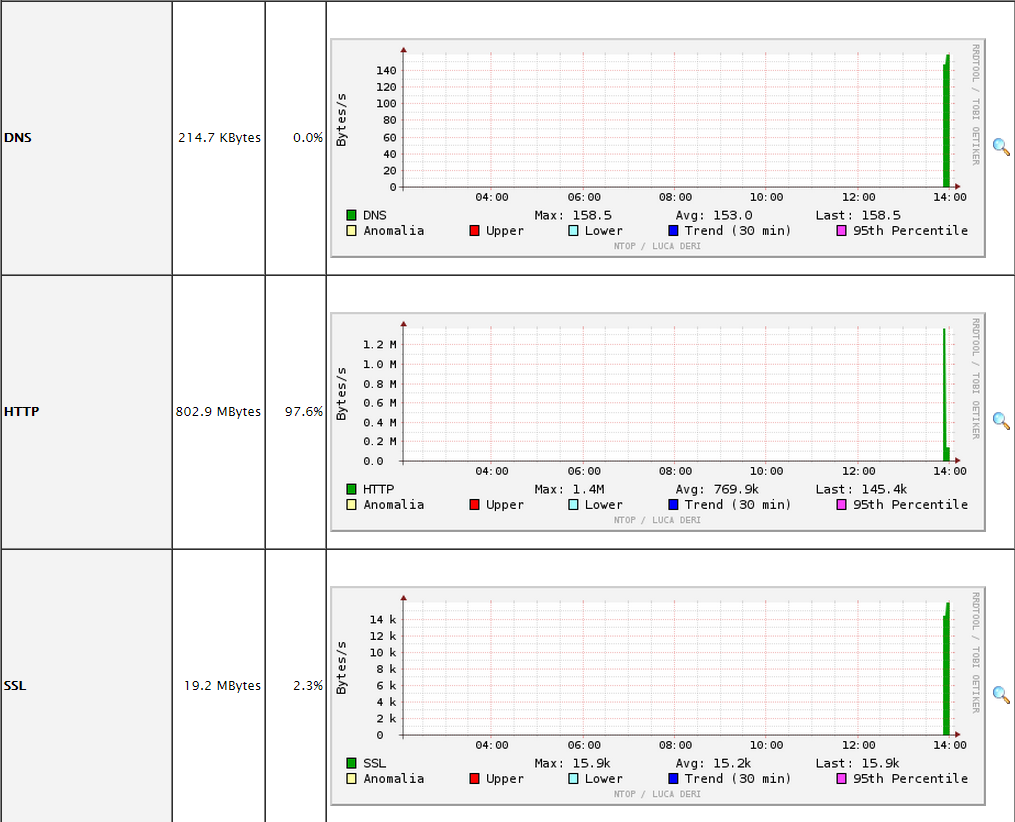
You can also see the throughput for each application:
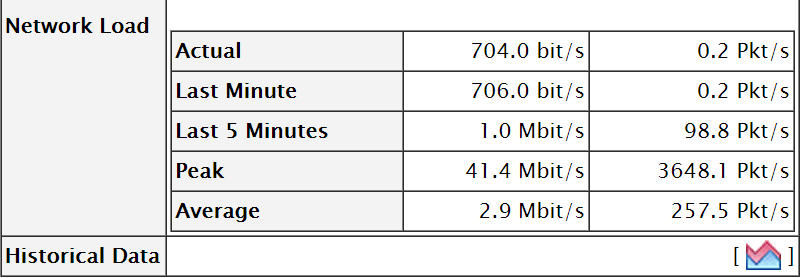
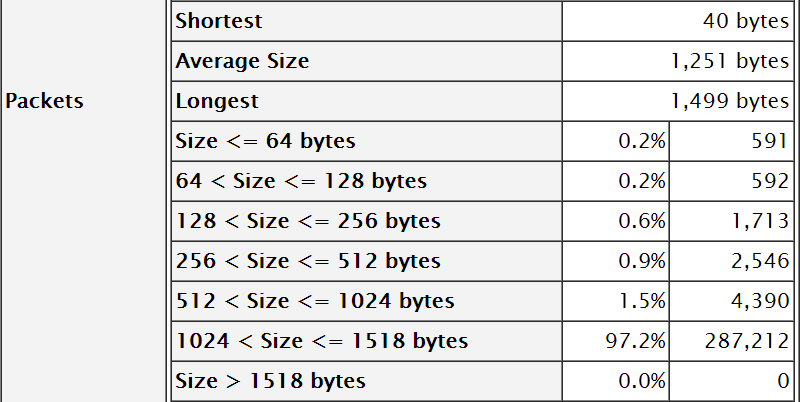
You can also see the different packet sizes that are used in your flows:
Conclusion
NetFlow is a great protocol to get an insight in your network traffic. It’s the equivalent of a “phone bill” that specifies all calls that were made, where these calls took place, the duration, etc. Only this time, we are tracking all IP packets on the network.


Rene,
Hello, This looks great! Does NetFlow run on ASA?
Thanks,
Chris
Rene,
Hello, I found it, looks like this could be a nice setup.
Chris
Hi Chris,
Good to hear you found it, the ASA supports NetFlow.
Rene
Rene,
Great lesson however, I have question F0/0 is for updates which means all the stats will be sent to the server through F0/0 for all the interfaces where we configure netflow.
Can we use loopback for updates or it has to be a physical interface?
F0/1 is an example where we configure netflow it means all the stats on this interface will be sent to the server through F0/0.
Please clarify.
Thanks
Hamood
Hi Hamood,
You can use a loopback and yes, that would be a good idea because of this reason.
Rene