Lesson Contents
Even if you have never heard of syslog before, you probably have seen it when you worked on a router or switch. Take a look at the following lines:
R1#
*Feb 14 09:38:48.132: %SYS-5-CONFIG_I: Configured from console by console
R1#
*Feb 14 09:40:09.325: %LINK-3-UPDOWN: Interface GigabitEthernet0/1, changed state to up
*Feb 14 09:40:10.326: %LINEPROTO-5-UPDOWN: Line protocol on Interface GigabitEthernet0/1, changed state to upWhenever anything interesting is happening on the router or switch, Cisco IOS informs us in real-time. This is done by syslog.
By default, these syslog messages are only outputted to the console. This is because the logging console command is enabled by default. If you log in through telnet or SSH, you won’t see any syslog messages. You can enable this with the terminal monitor command.
Storing Syslog Messages
Local History
Logging to the console or telnet/SSH is useful if you are around but what if you are not or if you want to see some older messages? Fortunately for us, Cisco IOS keeps a history of syslog messages. We can see these with the show logging command:
R1#show logging
Syslog logging: enabled (0 messages dropped, 3 messages rate-limited, 0 flushes, 0 overruns, xml disabled, filtering disabled)

No Active Message Discriminator.


No Inactive Message Discriminator.


    Console logging: level debugging, 34 messages logged, xml disabled,
                     filtering disabled
    Monitor logging: level debugging, 0 messages logged, xml disabled,
                     filtering disabled
    Buffer logging:  level debugging, 34 messages logged, xml disabled,
                    filtering disabled
    Exception Logging: size (8192 bytes)
    Count and timestamp logging messages: disabled
    Persistent logging: disabled

No active filter modules.

    Trap logging: level informational, 38 message lines logged
        Logging Source-Interface:       VRF Name:

Log Buffer (8192 bytes):

*Mar  1 00:00:01.137: %VIRTIO-3-INIT_FAIL: Failed to initialize device, PCI 0/6/0/1002 , device is disabled, not supported
*Mar  1 00:00:01.381: %ATA-6-DEV_FOUND: device 0x1F0
*Mar  1 00:00:08.485: %ATA-6-DEV_FOUND: device 0x171
*Mar  1 00:00:08.704: %NVRAM-5-CONFIG_NVRAM_READ_OK: NVRAM configuration 'flash:/nvram' was read from disk.
*Feb  8 08:51:58.706: %PA-3-PA_INIT_FAILED: Performance Agent failed to initialize (Missing Data License)
*Feb  8 08:52:05.064: %LINK-3-UPDOWN: Interface GigabitEthernet0/0, changed state to up
*Feb  8 08:52:05.068: %LINK-3-UPDOWN: Interface GigabitEthernet0/1, changed state to up
Above we can see some syslog messages in our history, it will store up to 8192 bytes of syslog messages in its RAM. When you reboot your router or switch, the history will be gone. It is possible to increase the size of the logging buffer. For example:
R1(config)#logging buffered 16384This reserves up to 16384 bytes of RAM for syslog messages. We can see it here:
R1#show logging | include Log Buffer
Log Buffer (16384 bytes):
Syslog Server
A local history is nice but it is stored in RAM. If you reboot the router or switch, it will be gone. What if the router crashed and you want to see if it logged anything before it went down? If you have dozens of routers and switches, logging into each device one-by-one to look for syslog messages is also not the best way to spend your time.
In production networks, we use a central server called a syslog server. Syslog is a protocol, a standard and you can configure your routers and switches to forward syslog messages to the syslog server like this:
R1(config)#logging 192.168.1.2Here’s a screenshot of a syslog server:
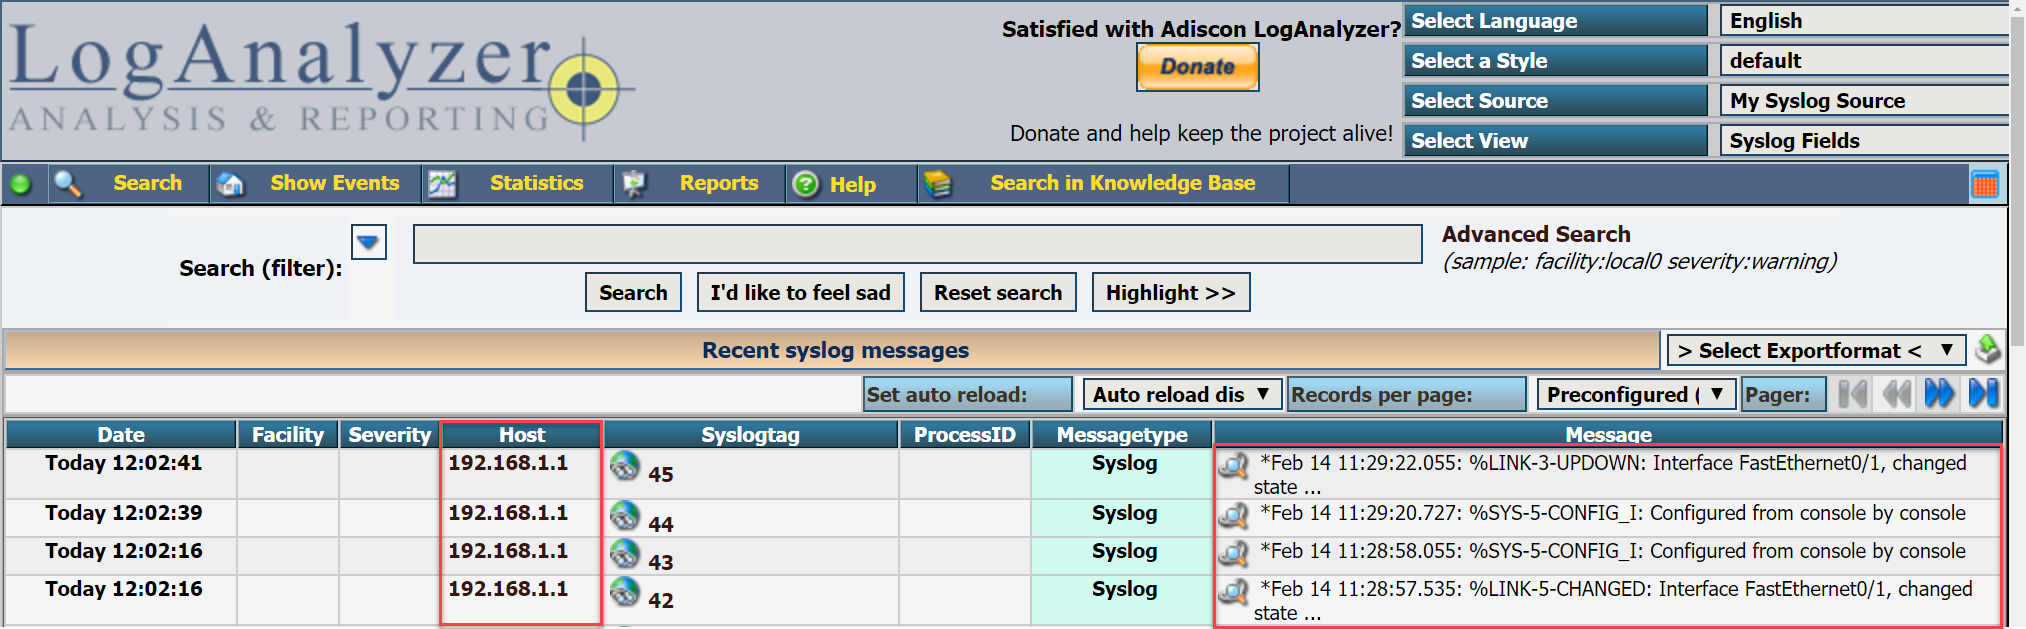
Above you can see some syslog messages from 192.168.1.1 (my router). You can also use filters to search for certain syslog messages and more.
Syslog Message Format
Let’s take a closer look at one of the syslog messages:
R1#
*Feb 14 09:40:10.326: %LINEPROTO-5-UPDOWN: Line protocol on Interface GigabitEthernet0/1, changed state to up
Above we can see that the line protocol of interface GigabitEthernet0/1 went up but there’s a bit more info than just that. Let me break down how Cisco IOS formats these log messages:
- timestamp: Feb 14 0:40:10.326
- facility: %LINEPROTO
- severity level: 5
- mnemonic: UPDOWN
- description: Line protocol on Interface GigabitEthernet0/1, changed state to up
The timestamp is pretty much self explanatory, without it you would never know when an event has occured. It is possible to disable it and/or replace it with sequence numbers. Here’s a quick example:
R1(config)#no service timestampsR1#
%LINK-5-CHANGED: Interface FastEthernet0/1, changed state to administratively downHere’s how to enable sequence numbers:
R1(config)#service sequence-numbersR1#
000045: %SYS-5-CONFIG_I: Configured from console by console
000046: %LINK-3-UPDOWN: Interface FastEthernet0/1, changed state to upThe syslog is basically the process that generated the syslog message. If you look at some of the syslog messages above, you can see %LINEPROTO which keeps track of line protocols, %SYS for general system messages and %LINK for interfaces that went up or down.
The severity level is an important one, it tells us how important the message is. Not everything that happens on your router or switch is equally important. I’ll get back to this in a bit.
The mnemonic is a short code for the message. For example, “UPDOWN” for interfaces that go up or down. “CHANGED” for when the interface status changes and so on. These can be useful if you are glancing over some syslog messages, looking for particular message types.
Syslog Severity Levels
Let’s take a closer look at the severity levels. There are different severity levels for logging information. An interface that goes down is probably more important to know than a message that tells us we exited the global configuration. In total there are 8 severity levels:
0. Emergency
1. Alert
2. Critical
3. Error
4. Warning
5. Notice
6. Informational
7. Debug
the lower the number, the more important the syslog message is. Alert and emergency are used when something bad is going on, like when your router runs out of memory and a process crashes. The critical, error and warning messages are used for important events like interfaces that go down. Here’s an example:
R1#
*Feb 14 12:02:38: %LINK-5-CHANGED: Interface FastEthernet0/1, changed state to administratively down
Above you can see the 5 for an interface that administratively shut down. Here’s an interface that is back up:
R1#
*Feb 14 12:03:36: %LINK-3-UPDOWN: Interface FastEthernet0/1, changed state to up
This is considered an important event with severity level 3.
If you are debugging something on the router, then you probably want to see your debug messages on your console but maybe you don’t want to send those same messages to your syslog server or to the router’s local syslog history. Cisco IOS allows you to define what syslog messages you want to see, save or send to the syslog server. For example:
R1(config)#logging console ?
  <0-7>          Logging severity level
  alerts         Immediate action needed           (severity=1)
  critical       Critical conditions               (severity=2)
  debugging      Debugging messages                (severity=7)
  discriminator  Establish MD-Console association
  emergencies    System is unusable                (severity=0)
  errors         Error conditions                  (severity=3)
  filtered       Enable filtered logging
  guaranteed     Guarantee console messages
  informational  Informational messages            (severity=6)
  notifications  Normal but significant conditions (severity=5)
  warnings       Warning conditions                (severity=4)
  xml            Enable logging in XML
  <cr>
With the logging console command, I can decide what severity levels I want to see on the console. The default is to show everything up to debug messages which is fine:
R1(config)#logging console debuggingI can do the same thing for syslog messages when you are logged in through telnet or SSH:
R1(config)#logging monitor debuggingSince the local storage of the router or switch is limited, perhaps you want to store only warnings and higher severity levels:
R1(config)#logging buffered warningsYou can verify this with the following command:
Great lesson Rene.
Well done, very good explanation, straight forward
Renee - Can you possibly give an example of a message that we would see regarding each severity level or an action that would result in us seeing 0-7
Thanks!
Hi Alex,
If you want to get an idea what messages are logged and at what level then this is a nice document by Cisco:
http://www.cisco.com/c/en/us/td/docs/security/asa/syslog-guide/syslogs/logsevp.html
It’s for the ASA but IOS produces similar messages.
Rene
hello Rene Molenaar
I would like to know how to setup Multilayer switch into GNS3.Please reply to me sir.
Best Regard.