Lesson Contents
TCP (Transmission Control Protocol) is a connection oriented protocol which means that we keep track of how much data has been transmitted. The sender will transmit some data and the receiver has to acknowledge it. When we don’t receive the acknowledgment in time then the sender will re-transmit the data.
TCP uses “windowing” which means that a sender will send one or more data segments and the receiver will acknowledge one or all segments. When we start a TCP connection, the hosts will use a receive buffer where we temporarily store data before the application can process it.
When the receiver sends an acknowledgment, it will tell the sender how much data it can transmit before the receiver will send an acknowledgment. We call this the window size. Basically, the window size indicates the size of the receive buffer.
Typically the TCP connection will start with a small window size and every time when there is a successful acknowledgement, the window size will increase. Here’s an example:
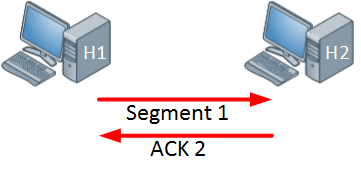
Above we have two hosts, the host on the left side will send one segment and the host on the right side will send an acknowledgment in return. Since the acknowledgement was successful, the windows size will increase:
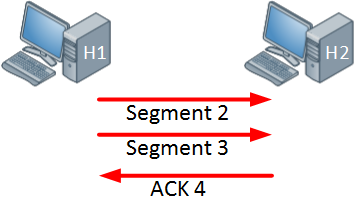
The host on the left side is now sending two segments and the host on the right side will return a single acknowledgment. Everything is working fine so the window size will increase even further:
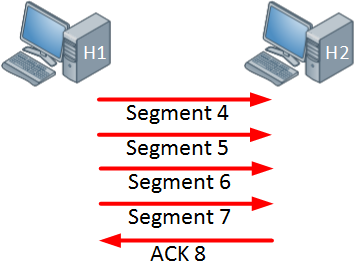
The host is now sending four segments and the host on the right side responds with a single acknowledgment.
In the example above the window size keeps increasing as long as the receiver sends acknowledgments for all our segments or when the window size hits a certain maximum limit. When the receiver doesn’t send an acknowledgment within a certain time period (called the round-trip time) then the window size will be reduced.
When an interface has congestion then it’s possible that IP packets are dropped. To deal with this, TCP has a number of algorithms that deal with congestion control. One of them is called slow start.
With TCP slow start, the window size will initially grow exponentially (window size doubles) but once a packet is dropped, the window size will be reduced to one segment. It will then grow exponentially again until the window size is half of what it was when the congestion occurred. At that moment, the window size will grow linearly instead of exponentially.
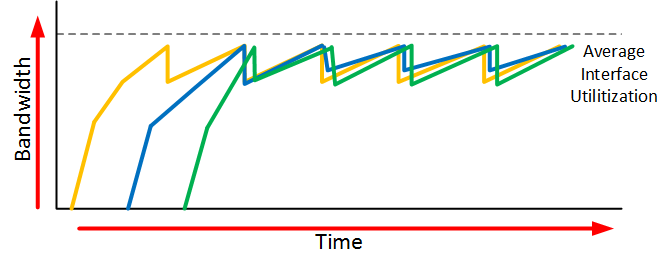
When an interface gets congested, it’s possible that all your TCP connections will experience TCP slow start. Packets will be dropped and then all TCP connections will have a small window size. This is called TCP global synchronization. Here’s what it looks like:
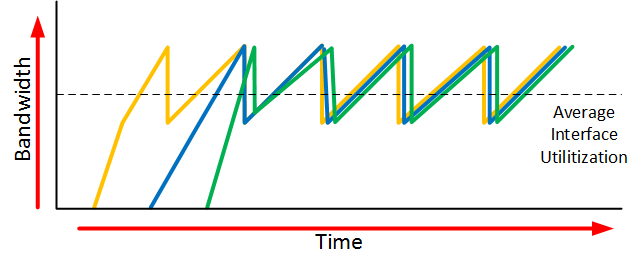
The orange, blue and green lines are three different TCP connections. These TCP connections start at different times and after awhile, the interface gets congested and packets of all TCP connections are dropped. What happens is that the window size of all these TCP connections will drop to one and once the interface congestion is gone, all their window sizes will increase again.
The interface then gets congested again, the window size drops back to one and the story repeats itself. The result of this is that we don’t use all the available bandwidth that our interface has to offer. If you look at the dashed line you can see that we the average interface utilization isn’t very high.
To prevent global synchronization we can use RED (Random Early Detection). this is a feature that drops “random” packets from TCP flows based on the number of packets in a queue and the TOS (Type of Service) marking of the packets. When packets are dropped before a queue is full, we can avoid the global synchronization.
The end result will look similar to this:
When we use RED, our average interface utilization will improve.
Now you have an idea what the TCP window size is about, let’s take a look at a real example of how the window size is used. We can use wireshark for this.
Wireshark Captures
To examine the TCP window size I will use two devices:
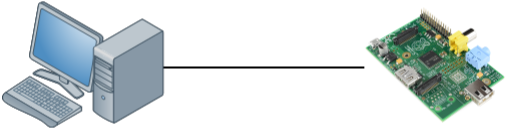
The device on the left side is a modern computer with a gigabit interface. On the right side, we have a small raspberry pi which has a FastEthernet interface. The raspberry pi is a great little device but it’s cpu / memory / ethernet interface are limited. To get an interesting output, I will copy a large file through SSH from my computer to the raspberry pi which will be easily overburdened.
Here’s what happened, take a look at this picture:
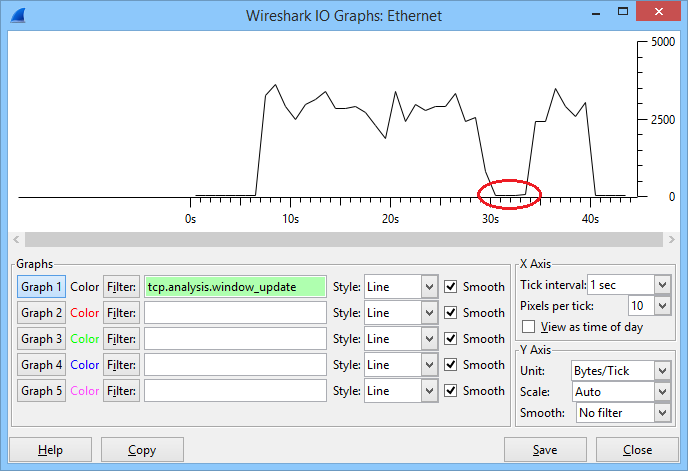
In the graph above you can see the window size that was used during this connection. The file transfer started after about 6 seconds and you can see that the window size increased fast. It went up and down a bit but at around 30 seconds, it totally collapsed. After a few seconds it increased again and I was able to complete the file transfer. Let’s take a closer look at this file transfer, which starts with the three way handshake:

My fast computer uses 10.56.100.1 and the raspberry pi uses 10.56.100.164. Above you can see that in the SYN,ACK message that the raspberry pi wants to use a window size of 29200. My computer wants to use a window size of 8388480 (win=65535 * ws=128) which is irrelevant now since we are sending data to the raspberry pi.
After a few packets, the window size of the Raspberry Pi looks like this:
Frame 639: 60 bytes on wire (480 bits), 60 bytes captured (480 bits) on interface 0
Ethernet II, Src: Raspberr_68:1e:36 (b8:27:eb:68:1e:36), Dst: AsustekC_7d:22:8c (74:d0:2b:7d:22:8c)
Internet Protocol Version 4, Src: 10.56.100.164 (10.56.100.164), Dst: 10.56.100.1 (10.56.100.1)
Transmission Control Protocol, Src Port: 22 (22), Dst Port: 56748 (56748), Seq: 2520, Ack: 51956, Len: 0
    Source Port: 22 (22)
    Destination Port: 56748 (56748)
    [Stream index: 16]
    [TCP Segment Len: 0]
    Sequence number: 2520 (relative sequence number)
    Acknowledgment number: 51956 (relative ack number)
    Header Length: 20 bytes
    .... 0000 0001 0000 = Flags: 0x010 (ACK)
        000. .... .... = Reserved: Not set
        ...0 .... .... = Nonce: Not set
        .... 0... .... = Congestion Window Reduced (CWR): Not set
        .... .0.. .... = ECN-Echo: Not set
        .... ..0. .... = Urgent: Not set
        .... ...1 .... = Acknowledgment: Set
        .... .... 0... = Push: Not set
        .... .... .0.. = Reset: Not set
        .... .... ..0. = Syn: Not set
        .... .... ...0 = Fin: Not set
    Window size value: 2070
    [Calculated window size: 132480]
    [Window size scaling factor: 64]
    Checksum: 0x102f [validation disabled]
    Urgent pointer: 0
    [SEQ/ACK analysis]
Above you can see that the window size has increased to 132480. Originally the window size is a 16 bit value so the largest window size would be 65535. Nowadays we use a scaling factor so that we can use larger window sizes.
At around the 10 second mark the window size decreased. Here’s what happened:
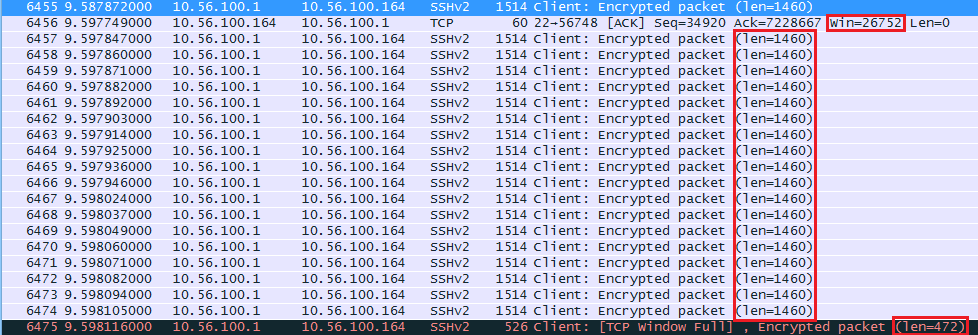
The raspberry pi seems to have trouble keeping up and its receive buffer is probably full. It tells the computer to use a window size of 26752 from now on. The computer sends 18 segments with 1460 bytes and one segment of 472 bytes (26752 bytes in total). The last packet shows us “TCP Window Full” message. This is something that wireshark reports to us, our computer has completely filled the receive buffer of the raspberry pi.
Once the raspberry pi has caught up a bit and around the 30 second mark, something bad happens. Take a look at the wireshark capture below:
![]()
Above you can see that the raspberry pi sends an ACK to the computer with a window size of 0. This means that the window size will remain at 0 for a specified amount of time, the raspberry pi is unable to receive any more data at this moment and the TCP transmission will be paused for awhile while the receive buffer is processed.
Here’s the actual packet:
Frame 53982: 60 bytes on wire (480 bits), 60 bytes captured (480 bits) on interface 0
Ethernet II, Src: Raspberr_68:1e:36 (b8:27:eb:68:1e:36), Dst: AsustekC_7d:22:8c (74:d0:2b:7d:22:8c)
Internet Protocol Version 4, Src: 10.56.100.164 (10.56.100.164), Dst: 10.56.100.1 (10.56.100.1)
Transmission Control Protocol, Src Port: 22 (22), Dst Port: 56748 (56748), Seq: 268280, Ack: 66840816, Len: 0
    Source Port: 22 (22)
    Destination Port: 56748 (56748)
    [Stream index: 16]
    [TCP Segment Len: 0]
    Sequence number: 268280 (relative sequence number)
    Acknowledgment number: 66840816 (relative ack number)
    Header Length: 20 bytes
    .... 0000 0001 0000 = Flags: 0x010 (ACK)
        000. .... .... = Reserved: Not set
        ...0 .... .... = Nonce: Not set
        .... 0... .... = Congestion window Reduced (CWR): Not set
        .... .0.. .... = ECN-Echo: Not set
        .... ..0. .... = Urgent: Not set
        .... ...1 .... = Acknowledgment: Set
        .... .... 0... = Push: Not set
        .... .... .0.. = Reset: Not set
        .... .... ..0. = Syn: Not set
        .... .... ...0 = Fin: Not set
    Window size value: 0
    [Calculated window size: 0]
    [Window size scaling factor: 64]
    Checksum: 0xe829 [validation disabled]
    Urgent pointer: 0
    [SEQ/ACK analysis]
Above you can see that the window size is now 0. Once the receive buffer has been processed, the Raspberry Pi will send an ACK with a new window size:
Bravo. Even with me level of experience you cleared up some concepts for me. I love this site! Thanks Rene
Thanks Michael!
Rene,
Thanks, that was nice to see this in detail like you showed.
Chris
Dear Rene,
Thanks, you explain every thing very nice. May I have capture file for this lesson.
Hmm I’m not sure if I still have it, I’ll take a look.